1366. The Probability and Statistics Cookbook
1367. A Complete Introduction to R for Data Science
1368. One year in vis
1369. 10 Tips for Using Geolocation and Open Source Data to Fuel Investigations
1370. Using the terra R package to view, download and analyze Google Earth Engine Images
1371. Converting Between Currencies Using priceR
1372. Level Up Your Labels: Tips and Tricks for Annotating Plots
1373. Quick and easy ways to deal with long labels in ggplot2
1374. Small spatial multiples with R
1375. Replacing the Magrittr Pipe With the Native R Pipe
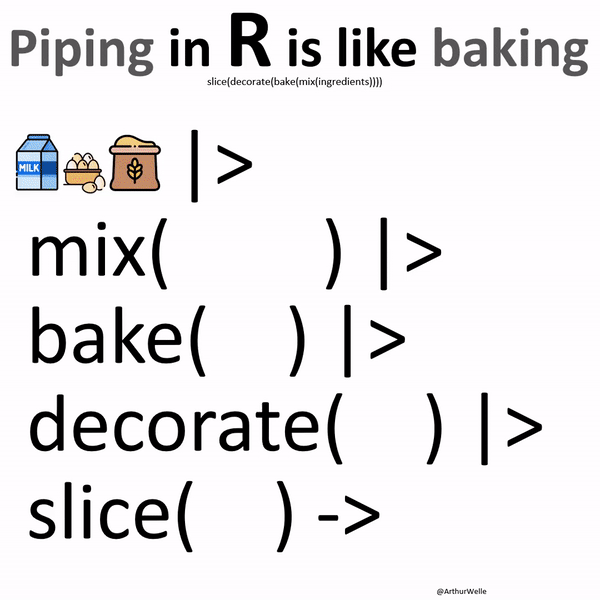
1376. Piping in R is like baking!
1377. A Business Analyst’s Introduction to Business Analytics
1378. Graph Machine Learning at Airbnb
1379. Deconvolution vs Clustering Analysis: An exploration via simulation
1380. Extracting spatial data from OpenStreetMap
1381. Compound pejoratives on Reddit – from buttface to wankpuffin
1382. A cross-verified database of notable people, 3500BC-2018AD
1383. How to build an interactive point-and-click game with {Shiny}
1384. Mapping a marathon with {rStrava}
1385. Introduction to GitHub Actions to R users
1386. What background color should your data vis have?
1387. Animated map of agricultural subsidies by US county (2010-2019)
1388. Tidy Finance with R
1389. Misleading graphs in context: Less misleading than expected
1390. DevOps for Data Science
1391. Ethical Principles for Web Machine Learning
1392. Python for Data Analysis
1393. BertViz: Visualize Attention in NLP Models
1394. How the Ancient Egyptians Built the Original Skyscrapers with Data
1395. The Poisson distribution: From basic probability theory to regression models
1396. Surviving from scratch
1397. Reshaping data frames using pivot functions from {tidyr} and tally from {dplyr}
1398. A Beginner’s Introduction to Mixed Effects Models
1399. Are Vertical Line Charts Ever a Good Idea?
1400. Streamlining with R
1401. Pen and Paper Exercises in Machine Learning
1402. Things You Should Know About Databases
1403. Publicly Available Emotional Speech Dataset (ESD) for Speech Synthesis and Voice Conversion
1404. Custom colour palettes for {ggplot2}
1405. Learning Statistical Models Through Simulation in R
1406. A Comprehensive Database on the FIFA World Cup
1407. How to do amazing Twitter network analysis in R
1408. Stepping into {ggplot2} internals with {ggtrace}
1409. Eight R Tidyverse tips for everyday data engineering
1410. Data in Wonderland
1411. Visualising knowledge: Lessons from 25 years of policy-related data visualisation
1412. A curated list of awesome posts, videos, and articles on leading a data team (small and large)
1413. Predicting with decision tress using rpart
1414. A Docker Tutorial for Beginners
1415. Correlation vs covariance: it’s much simpler than it seems
1416. Critical Dataset Studies Reading List
1417. bnomial: One machine learning question every day
1418. Doing more with data: An introduction to Arrow for R users
1419. Outrageously efficient exploratory data analysis with Apache Arrow and dplyr
Previous posts: #1 #2 #3 #4 #5 #6 #7 #8 #9 #10 #11 #12 #13 #14 #15 #16 #17 #18 #19 #20 #21 #22 #23 #24 #25 #26 #27 #28 #29 #30 #31 #32 #33 #34 #35 #36 #37 #38 #39 #40 #41 #42 #43 #44 #45 #46 #47 #48 #49 #50 #51 #52 #53 #54 #55 #56 #57 #58 #59 #60 #61 #62 #63 #64 #65 #66 #67 #68 #69 #70 #71 #72 #73 #74 #75 #76 #77 #78 #79 #80 #81 #82 #83 #84 #85