Here are ten R functions that have saved me a lot of time over the years.
1. forcats::fct_reorder()
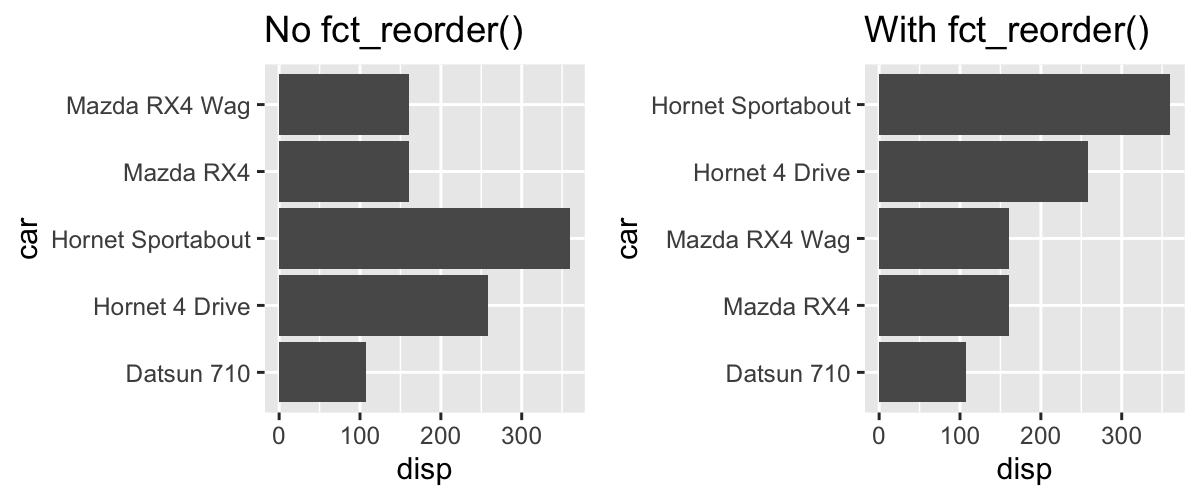
The forcats package has a lot of great functions. The one I use the most is the fct_reorder() function. I have also seen David Robinson using it a lot in his YouTube videos (I recommend his videos in this post).
The function is good to change the order of values in a factor variable, e.g. if you want to make sure there is some structure to the values you present in a bar chart:
2. countrycode::countrycode()
I have lost count of the number of times I have used the countrycode package. If you are doing comparative research and not using the countrycode() function, you are in for a treat.
In a lot of datasets you will not have the full country name (e.g. Denmark), but something like ISO 3166-1 alpha-2 codes (e.g. DK). The countrycode() function can easily return country names based on ISO codes (or vice versa). Here is an example:
countrycode(c("DK", "SE"),
            origin = "iso2c",
            destination = "country.name")
This code will return Denmark and Sweden. As you can see, you simply provide the “origin” (i.e. the type of data you have) and the “destination” (i.e. the type of data you would like). I especially find this function useful when I need to merge datasets with different country variables and when I want to present full country names in a visualisation instead of ISO codes.
Last, if you are working on a country-level dataset, make sure that it is easy to match the countries with any of the variables available in the countrycode package.
3. tidyr::separate_rows()
I recently had to work with a dataset where each country had several priorities in relation to the Sustainable Development Goals (SDGs). However, there was only one SDG variable with information on the relevant SDGs for each country. The separate_rows() function is great to turn such data into multiple rows.
df <- tibble(
  country = c(1, 2),
  SDG = c("SDG 5,SDG 17,SDG 3", "SDG 1,SDG 2,SDG 3")
)

df %>% separate_rows(SDG,
                     sep = ",",
                     convert = TRUE)
The sep argument is specifying what separator you would like to use to separate the information (in this case a comma). The code will return a tibble with two variables and six observations.
4. tidyr::crossing()
I often use the crossing() function when I need to create a data frame from scratch. For example, if you need to create a country-year data frame for a few countries from 1965 to 2021, you can create a data frame where each country has a row for each year. Here is an example:
crossing(country = c("Denmark", "Sweden"),
         year = 1965:2021,
         value = NA_real_)
5. stringi::stri_reverse()
I had to scrape a PDF file but the text I got from the document was reversed, e.g. ‘Agriculture’ was ‘erutlucirgA’. There might be different ways to do this in an easy way, but the function stri_reverse() in the stringi package did the trick. Here is a simple example:
x <- "snoitcnuf R taerg neT"

stringi::stri_reverse(x)
And what we get is: “Ten great R functions”.
6. purrr::reduce()
The reduce() function is a great to collapse repetitive piping. There is a good blog post on the function here. To illustrate, when I used to merge several data frames into one large data frame, I used multiple lines of left_join().
reduce(list(df_1, df_2,
            df_3, df_4),
       left_join,
       by = c("iso2c", "year"))
The code will left join all data frames on the iso2c and year variable.
7. dplyr::distinct()
If you have multiple rows in a data frame, e.g. multiple countries, but want a unique row for each country, you can use the distinct() function to get distinct rows. In the example below we have four rows but we turn them into a data frame with distinct rows on the variable x.
df <- tibble(
  x = c(1, 1, 2, 2),
  y = c(1, 1, 2, 4)
)

df %>% dplyr::distinct(x, .keep_all = TRUE)
8. fuzzyjoin::regex_left_join()
The regex_left_join() from the fuzzyjoin is great if you need to merge a data frame based upon a regular expression. I found this useful when I had to join data frames with different country names.
Here is a simple example where we join two data frames where it merges the rows for both “Denmark” and “denmark”.
df_1 <- data.frame(
  country = c("Denmark", "denmark"),
  year = 2020:2021
)

df_2 <- data_frame(regex_country = c("[Dd]enmark"),
                   type = 1:2)

df_1 %>%
  fuzzyjoin::regex_inner_join(df_2, by = c(country = "regex_country"))
9. ggplot2::labs()
I used to look up the theme() function when I had to remove the title of a legend, or use scale_x_continuous() if I had to change the title of the x-axis. Not anymore. The labs() function is an easy way to change the labels in your figure. You can also use it to change the title and subtitle of your figure. Highly recommended.
10. tidyr::drop_na()
When I check some of my old code, I often see lines like this:
df %>%
  filter(!is.na(var1))
However, there is a much easier way to do this, namely using the drop_na() function.
df %>%
  drop_na(var1)
This is not only much easier to write than having to rely on two functions, but also a lot easier to read.