This is a brief follow-up post to my previous post with advice on how you can improve your figures. Can it be worse than showing variable names instead of actual labels on your figures? Yes. You can have no labels at all.
Take a look at this article. It’s great and includes references to a lot of good material. However, for both figures provided in the article, it is not clear what exactly the y-axis is showing. Take the figure with the Fragile States Index as an example. What is a value of 5? What is a value of 6? Ideally, the figure should show that without you having to track down the source material (also, do notice how only countries doing better than the US is included to look the US look worse than it actually is).
I see missing labels now and then. Consider, for example, this article from the Comparative Political Studies. Here is Figure 1 (and the title legend):
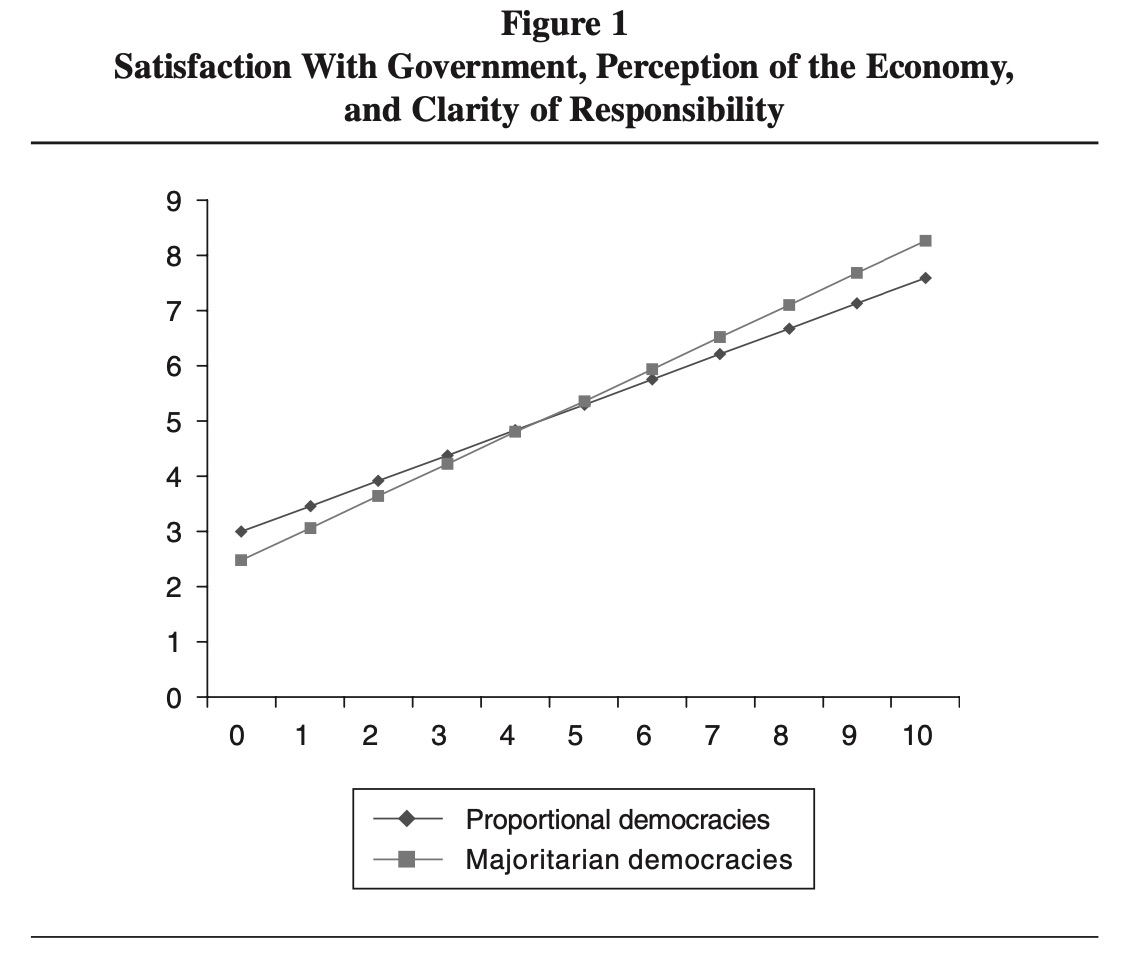
What you see is that there is no information on what is shown on the respective axes. The only thing you have is a series of numbers. “Satisfaction With Government, Perception of the Economy, and Clarity of Responsibility”, sure, but what is on the x-axis? What is on the y-axis? Figure 2 in the paper is similar to Figure 1, only with “Trust in Parliament” instead of “Satisfaction With Government”.
This is an extreme example but my recommendation is simple: Make sure that you always have labels that tell the reader what the figure is actually showing. Having no labels is highly problematic, showing variable names are problematic and showing informative labels is great.