When you plot a figure in your favourite statistical software, you will most likely see the name of the variable(s) you are plotting. If your income variable is called inc, your software will call the axis with income for inc and not income. In most cases variable names are not sufficient and you should, for that reason, not show variable names in your figures.
Good variable names are easy to read and write – and follow specific naming conventions. For example, you cannot (and should not) include spaces in your variable names. That is why we use underscores (_) to separate words in variable names. However, R, SPSS and Stata will happily show such underscores in your figures – and you need to fix that.
I believe this is data visualisation 101 but it is something I see a lot, including in published research. For example, take a look at this figure (Figure 1 from this paper):
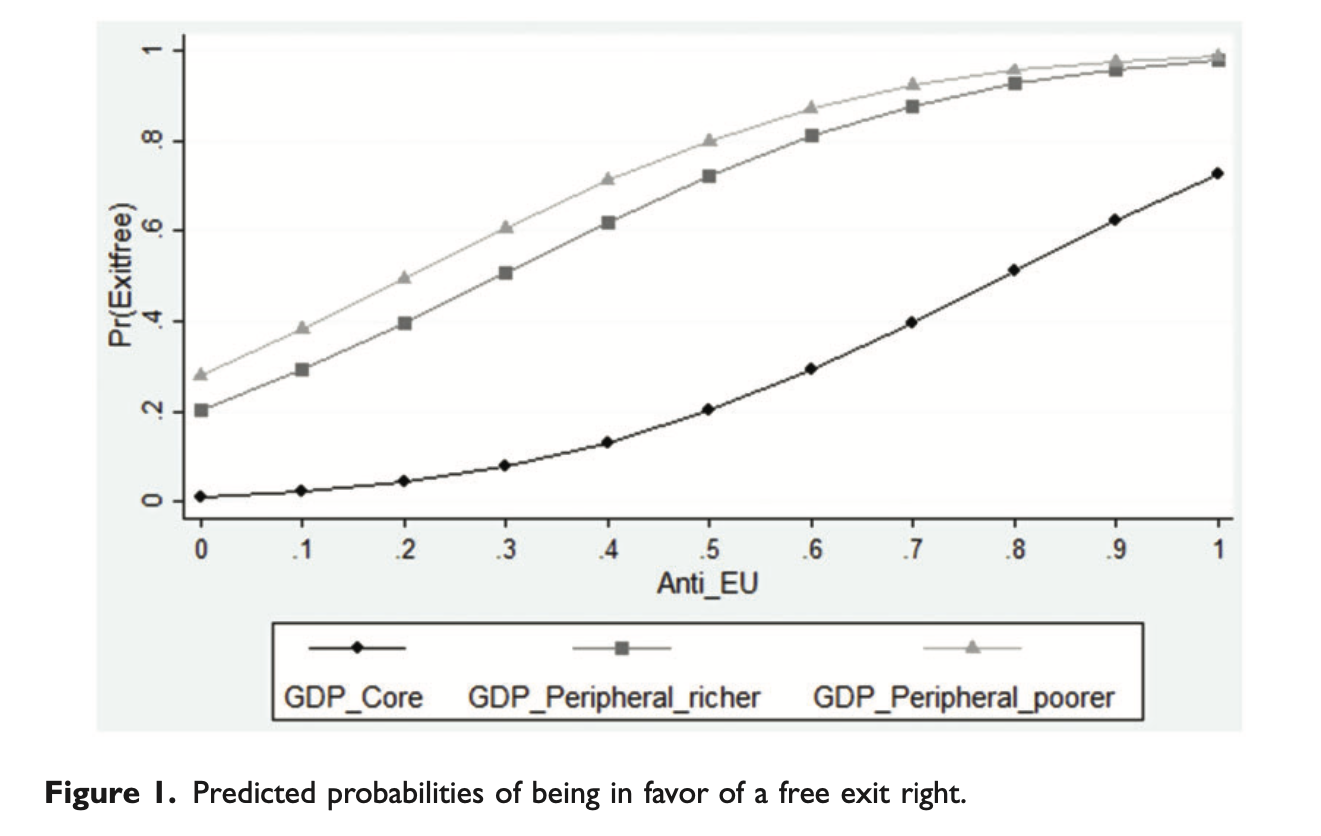
As you can see, we have Exitfree, Anti_EU and some GDP* variables. The good thing about this paper is that the variable names are mentioned in the main text as well: “Individuals and parties may have ideological objections to European integration and hence desire a free exit right irrespective of whether their country is peripheral. To control for this, a variable variable ‘Anti_EU’ is constructed based on the variable ‘eu_anti_pro’ in the ParlGov database”. However, I would still recommend that you do not show the actual variable names in the figures but use actual names (with spaces and everything).
Let’s look at another few examples from this paper. Here is the first figure:
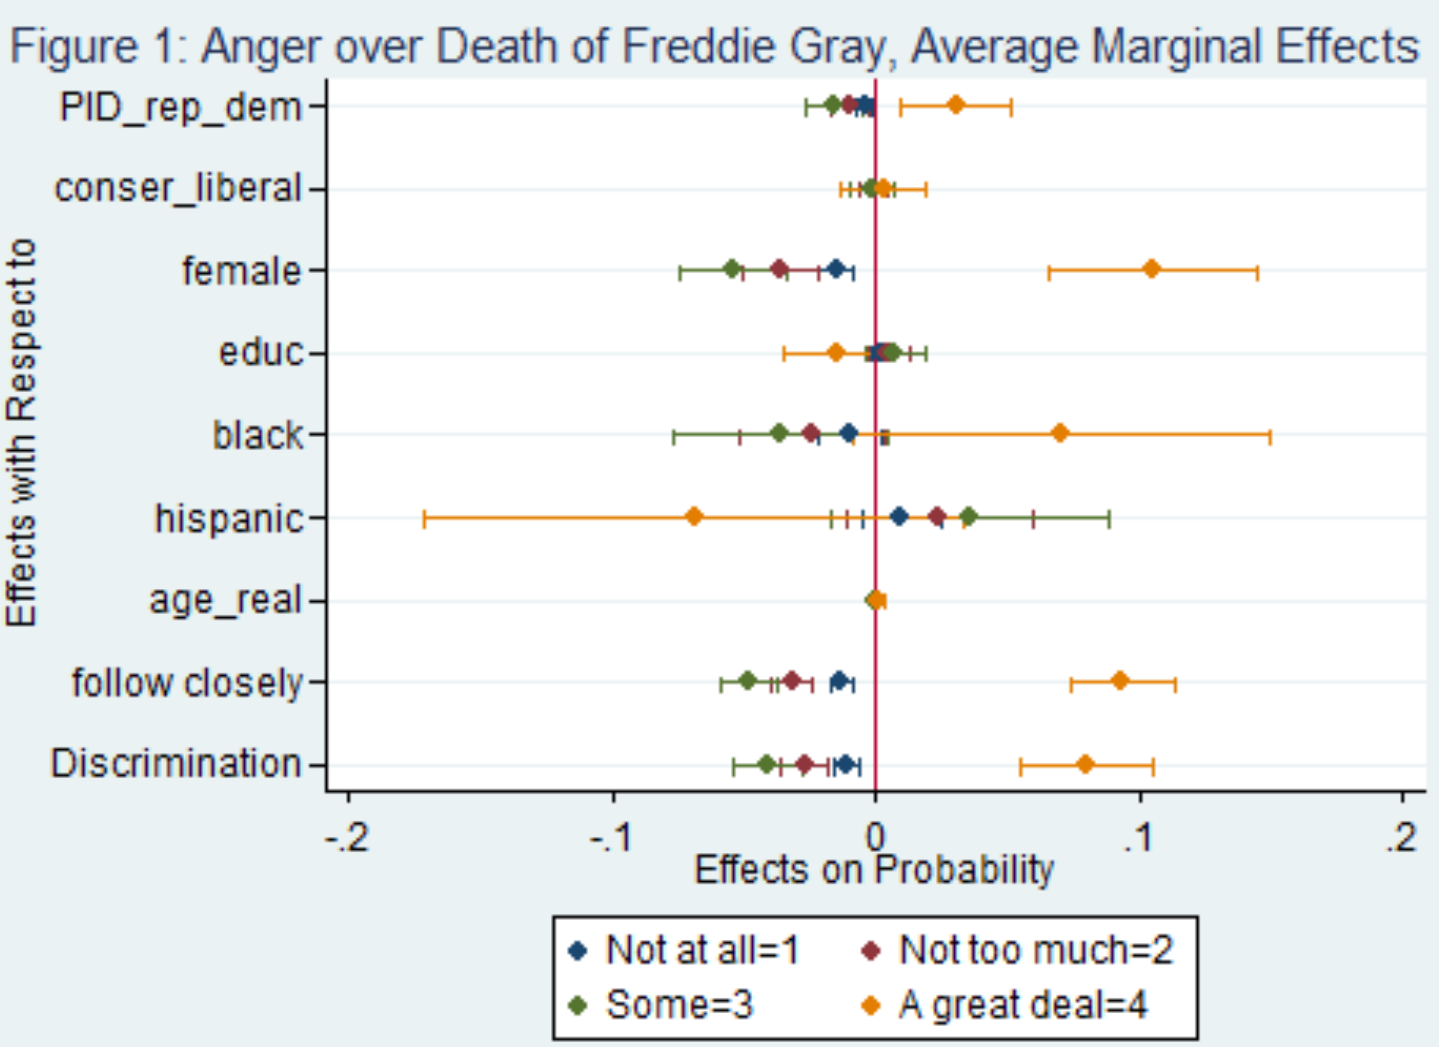
The important thing is not what the figure is about, but the labels. You will see labels such as PID_rep_dem and age_real. These are not good labels to have in a figure in a paper. age_real is not mentioned anywhere in the paper (only age as a covariate is mentioned).
Let us take a look at Figure 3 from the same paper:
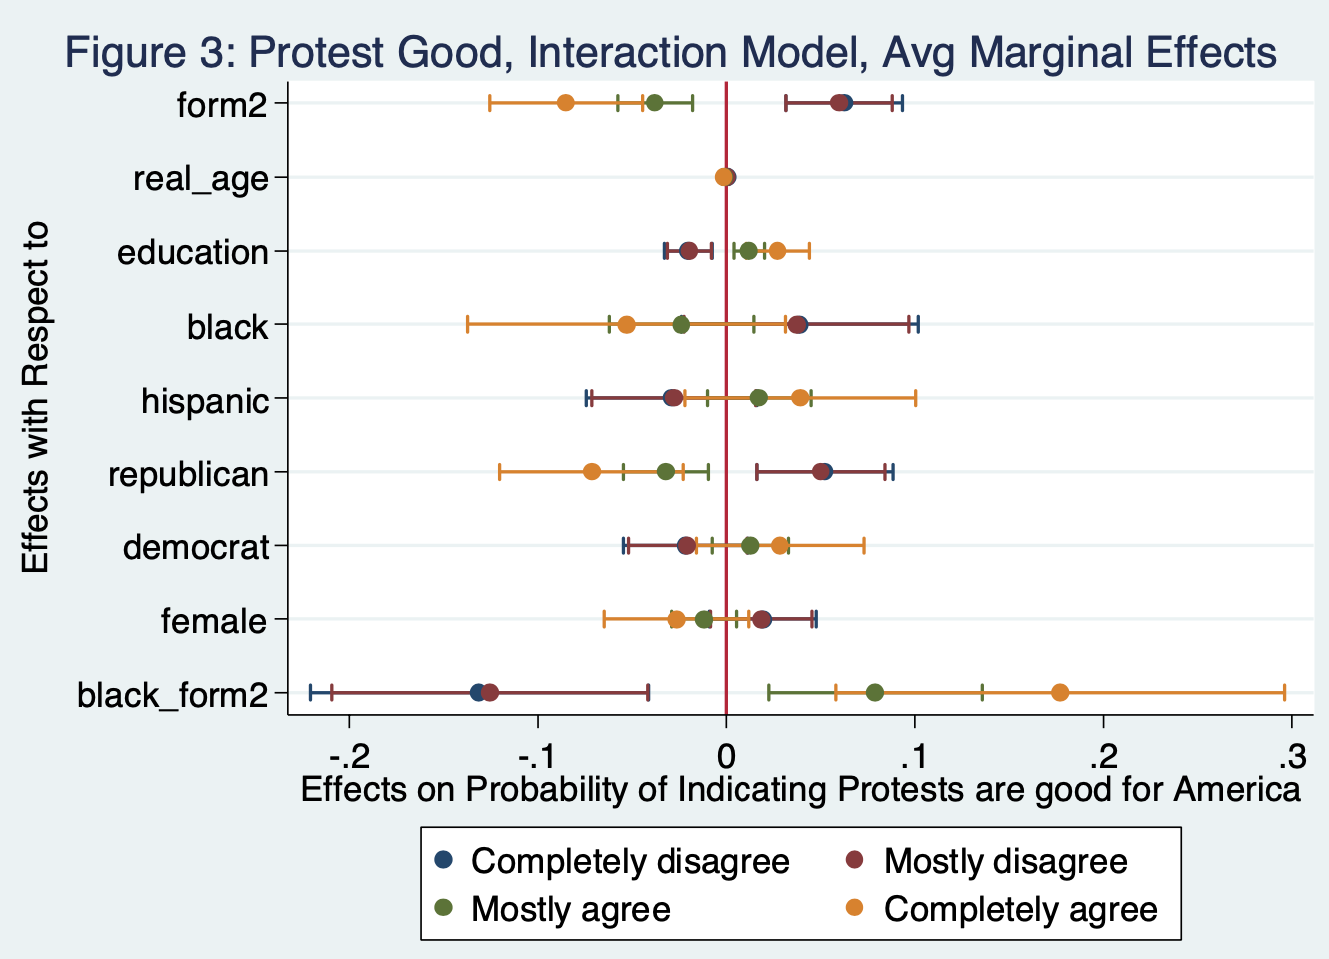
Here you will see a variable called form2. What was form 1? Is there a form 3? When we rely on variable names instead of clear labels, we introduce ambiguity and makes it difficult for the reader to understand what is going on. Notice also the difference between Figure 1 and Figure 3 for age, i.e. age_real and real_age. Are those variables the same (i.e. a correlation of 1)? And if that is the case, why have two age variables?
Okay, next example. Look at Figure 6 from this paper:
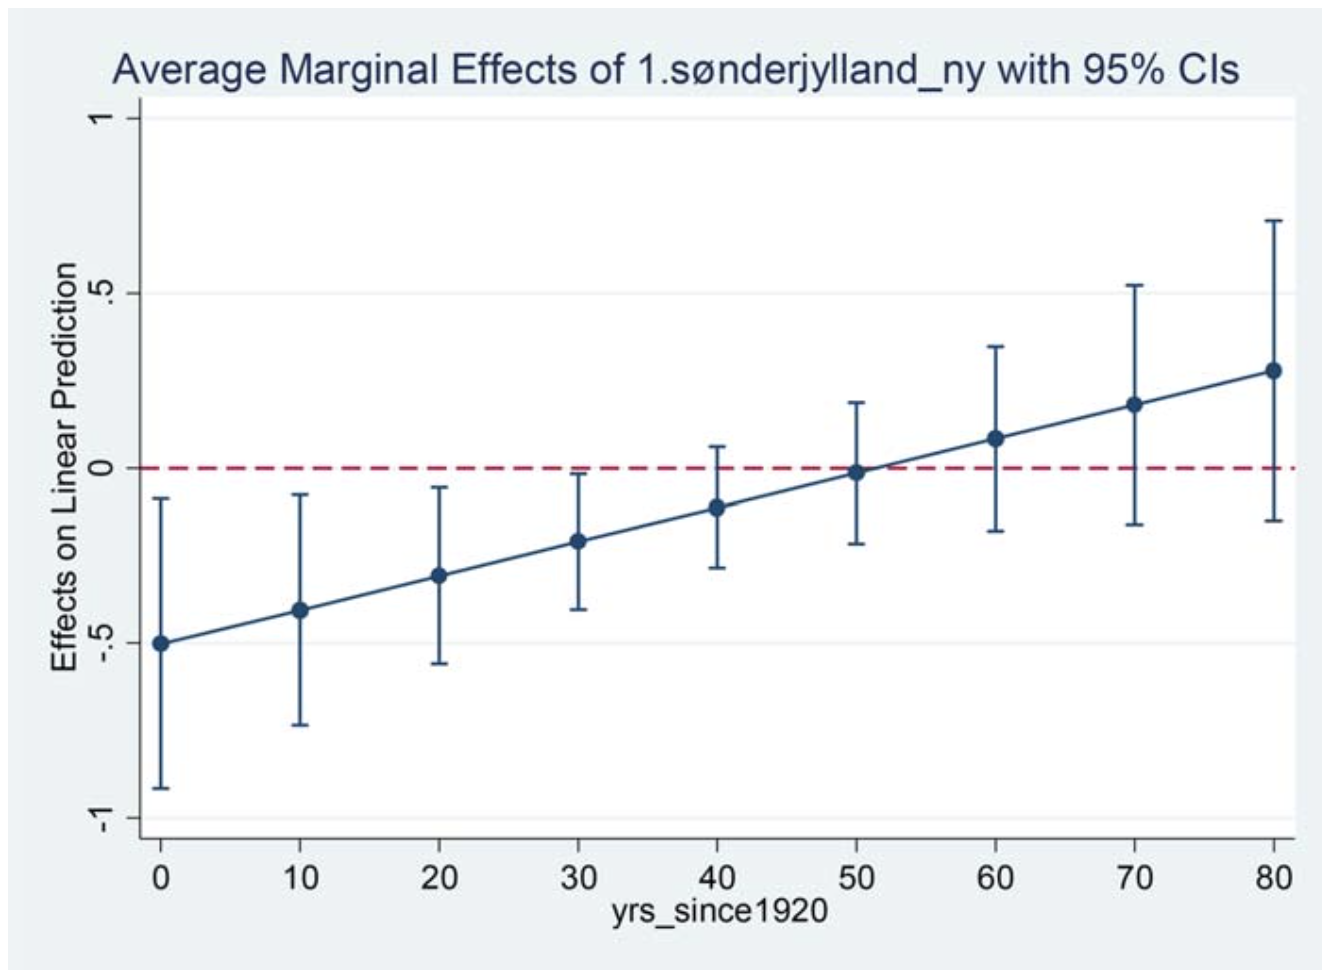
Here we see a variable on the x-axis called yrs_since1920 (years since 1920). It would be better having a label for this axis simply being “Years since 1920”. Or even better: just the year and having the actual years on the axis. Notice also here the 1.sønderjylland_ny label. Sønderjylland is not mentioned in the paper and it is not clear how ny (new in Danish) should be understood here (most likely that it wasn’t the first Sønderjylland variable that was created in the data).
Let’s take another example, specifically Figure 3 from this paper:
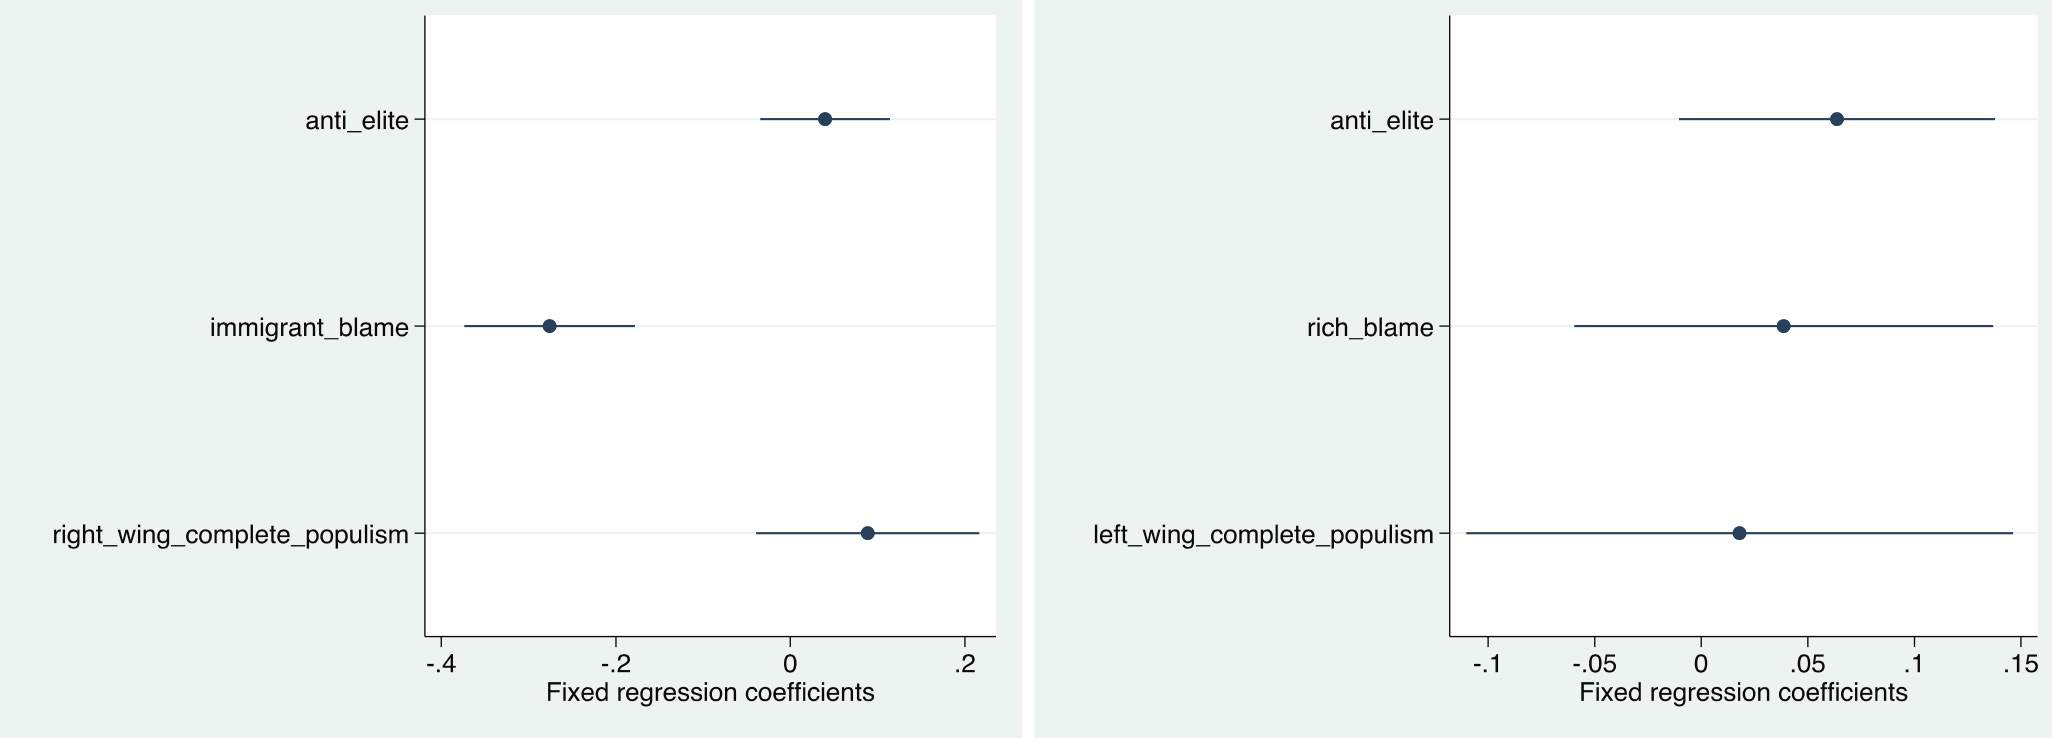
Here we see the good old underscores en masse. anti_elite, immigrant_blame, ring_wing_complete_populism, rich_blame and left_wing_complete_populism. There are 29 authors on the article in question. Too many cooks spoil the broth? Nahh, I am sure most of the authors on the manuscript didn’t even bother looking at the figures (also, if you want to have fun, take a critical look at the results provided in the appendix!).
And now I notice that all of the examples I have provided above are from Stata. I promise it is a coincidence. However, let’s take one last example from R just to confirm that it is not only an issue in Stata. Specifically, look at Figure 3 in this paper (or Figure 4, Figure 5 and Figure 6):
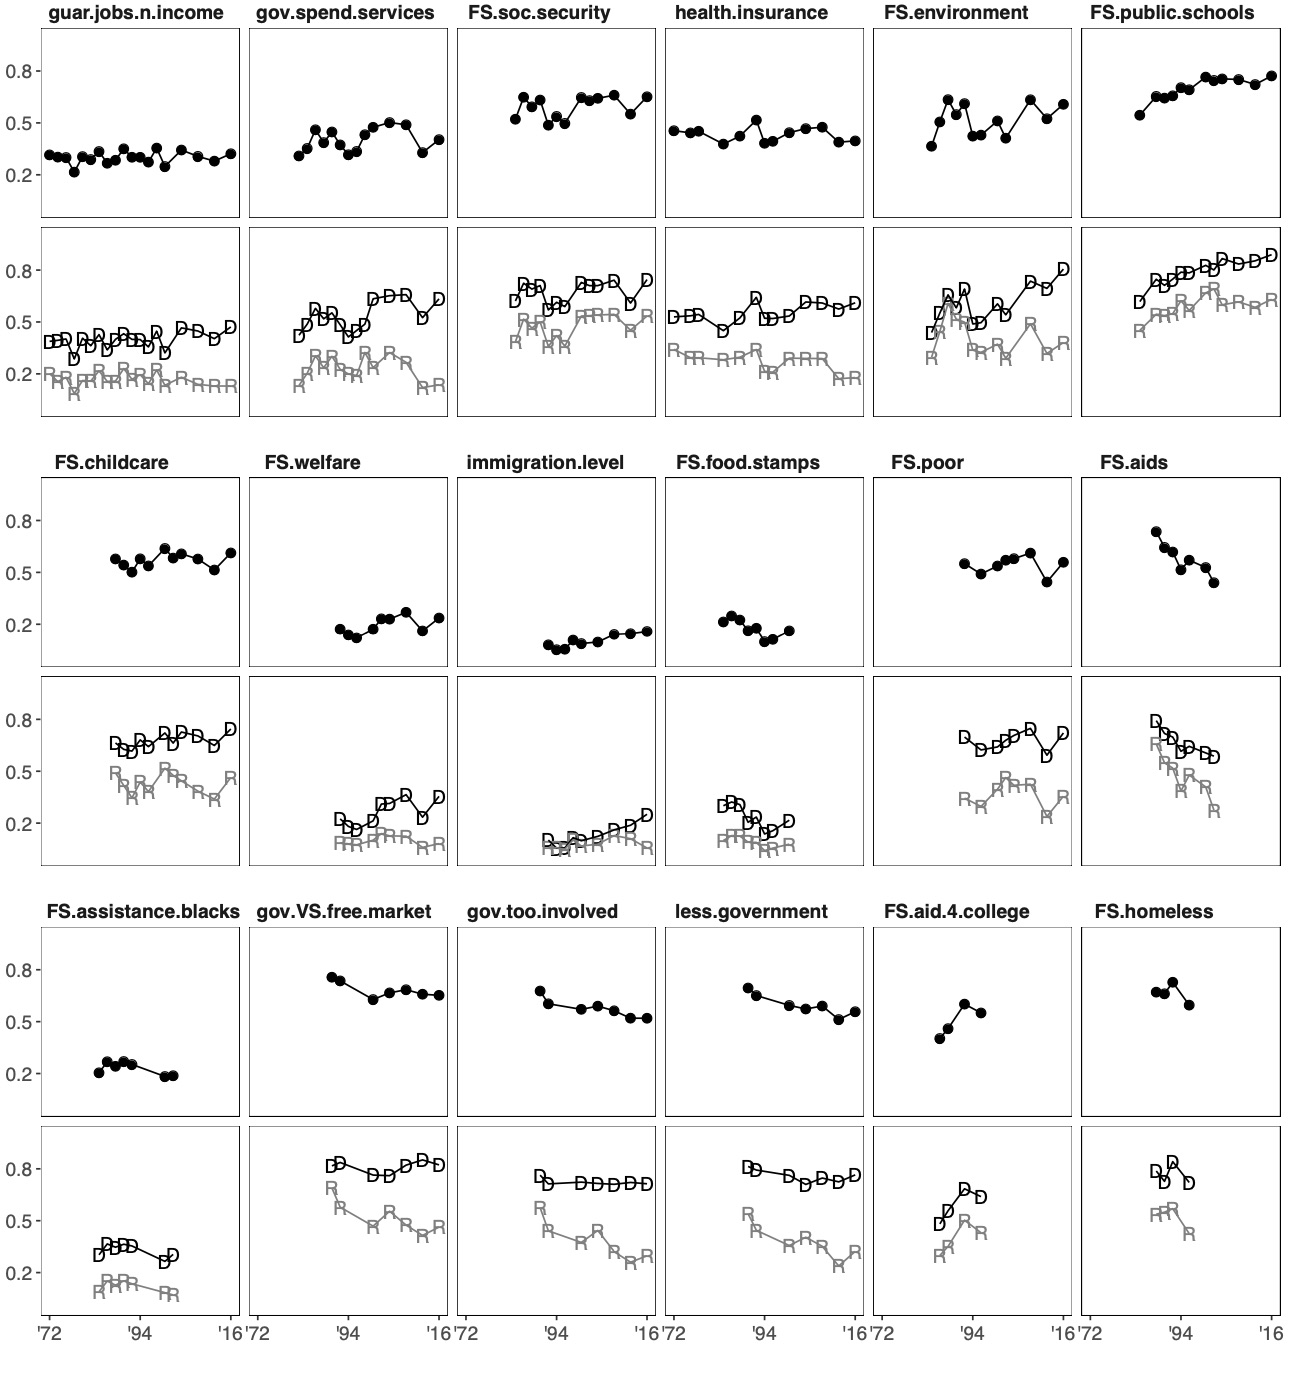
The figure show trends in public opinion on economic issues in the United States from 1972 to 2016. There are too many dots in the labels here. guar.jobs.n.income, FS.aid.4.college etc. are not ideal labels in your figure.
In sum, I like most of the papers above (there is a reason I found the examples in the first place). However, it is a major turn-off that the figures do not show actual labels but simply rely on the variable names or weird abbreviations to show crucial information.