The birthday problem is the fact that only 23 people are needed in a class for the probability that at least two students sharing the same birthday is at least 50%. It is a problem familiar to most people interested in statistics and probability theory. (And you only need 23 people in a statistics class for the probability of at least two people talking about the birthday problem to be at least 50%.) You can check out the Wikipedia page for more information on how to calculate the probability of the birthday problem.
Interestingly, the birthday problem is not a problem and definitely not a paradox. It might feel like a paradox but when you are familiar with the birthday problem, there is nothing paradoxical, let alone problematic, about it. On the contrary, other probability calculations can seem more paradoxical if you are vaguely familiar with the birthday problem. Take, for example, the question “How many people do you have to meet before it is more likely than not that you have met someone who shares your birthday?” (from the book Puzzle Me Twice). My anecdotal observation is that the more familiar people are with the birthday problem, the more likely they are – on average – to answer this particular question incorrectly.
In any case, here I will show how you can easily use R functions to work with the birthday problem. In fact, there are built-in functions in R that refer to the birthday problem! The two functions are stats::qbirthday() and stats::pbirthday(). Here is the description from the help page in R: “Computes answers to a generalised birthday paradox problem. pbirthday computes the probability of a coincidence and qbirthday computes the smallest number of observations needed to have at least a specified probability of coincidence.”
To get the number 23 introduced above, i.e., the number of people needed in a class for at least a 50% probability that two people share the same birthday, we use qbirthday() with the details required to get the 23.
qbirthday(prob = 0.5, classes = 365, coincident = 2)
#> [1] 23
You can see the three arguments being used in the function. prob is to get the number of people required for the probability to be at least prob (e.g., 50%). classes is the unique number of categories (days) that people can have a birthday (in this case 365 days in a year). coincident is the number of people that should share the same birthday (in this case 2 people).
These arguments can be changed to work with a series of different probability problems (not only the birthday problem). With this in mind we can now see, for example, how many people we would need for the probability to be greater than 99%.
qbirthday(prob = 0.99, classes = 365, coincident = 2)
#> [1] 57
Accordingly, if we have 57 people in a class, the probability that at least two people share the same birthday is at least 99%.
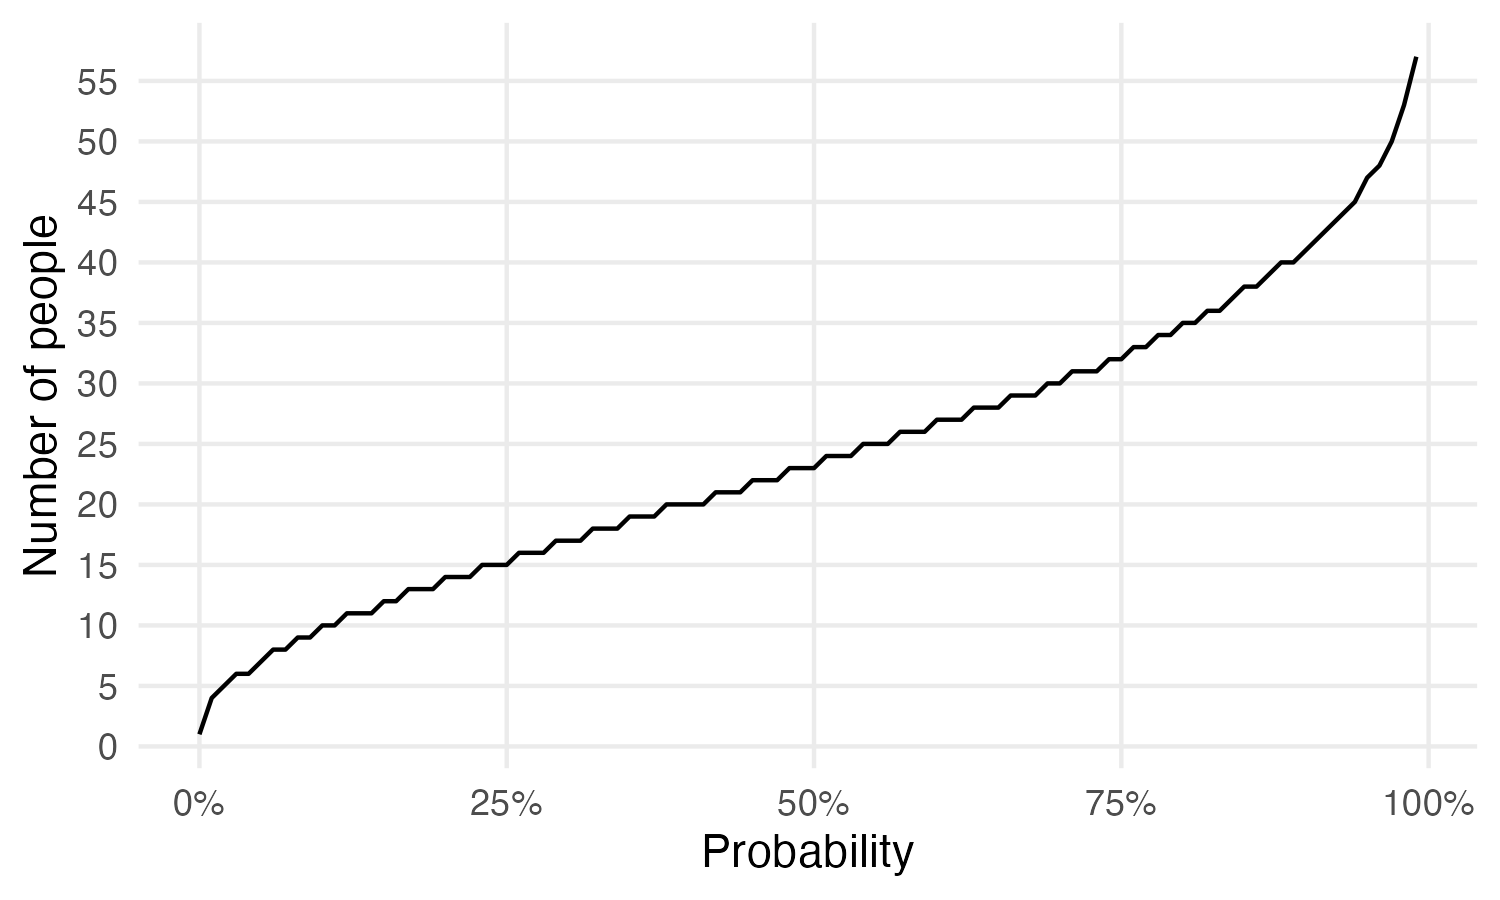
In the code below we create a data frame with the number of people we need in a class to have at least X% probability of two people sharing the same birthday for the probabilities 0% to 99%. Notice that we do not include 100% as we need 366 people in a class (in a no leap year) to be 100% sure that at least two people share the same birthday (we “only” need 89 people in class to have a probability of 99.999%).
people_needed <- sapply(seq(0, 0.99, length.out = 100),
                        function(p) qbirthday(prob = p,
                                              classes = 365,
                                              coincident = 2))

birthday_probs <- data.frame(prob = seq(0, 0.99, length.out = 100),
                             people = people_needed)

head(birthday_probs, 3)
#>   prob people
#> 1 0.00      1
#> 2 0.01      4
#> 3 0.02      5
To be 100% sure that nobody shares the same birthday, we need 1 person. If we have 4 people in a class, there is at least 1% probability that two people share the same birthday. We can plot the number of people needed in a class for the different probabilities.
library("ggplot2")

ggplot(birthday_probs, aes(prob, people)) +
    geom_line() +
    labs(y = "Number of people",
         x = "Probability") +
    scale_y_continuous(breaks = seq(0, 60, by = 5)) +
    scale_x_continuous(label = scales::label_percent()) +
    theme_minimal() +
    theme(panel.grid.minor = element_blank())
Finally, we can use the pbirthday() function to get the probability that at least two people share the same birthday in a class. Let us begin with the probability that at least two people share the same birthday in a class with 22 people.
pbirthday(22, classes = 365, coincident = 2)
#> [1] 0.4756953
This is ~48%, i.e., less than 50%. Let us now try it with 23 (as the examples above showed that the probability should now be more than 50%).
pbirthday(23, classes = 365, coincident = 2)
#> [1] 0.5072972
We can use these functions to explore different scenarios. What, for example, is the probability that at least three people in a class with 23 students share the same birthday?
pbirthday(23, classes = 365, coincident = 3)
#> [1] 0.01441541
Only ~1%. So how many people would we need in a class for the probability that at least 3 people share the same birthday to be at least 99%?
qbirthday(prob = 0.99, classes = 365, coincident = 3)
#> [1] 174
174. That is one big class, but I have taught classes with more students, so in those classes it is very likely that at least 3 students shared the same birthday.
Here we are. The two functions, qbirthday() and pbirthday(), make it easy to explore the birthday problem in R, and I am sure it is helpful in teaching statistics to let students understand the intuition behind the birthday problem and similar probability questions.