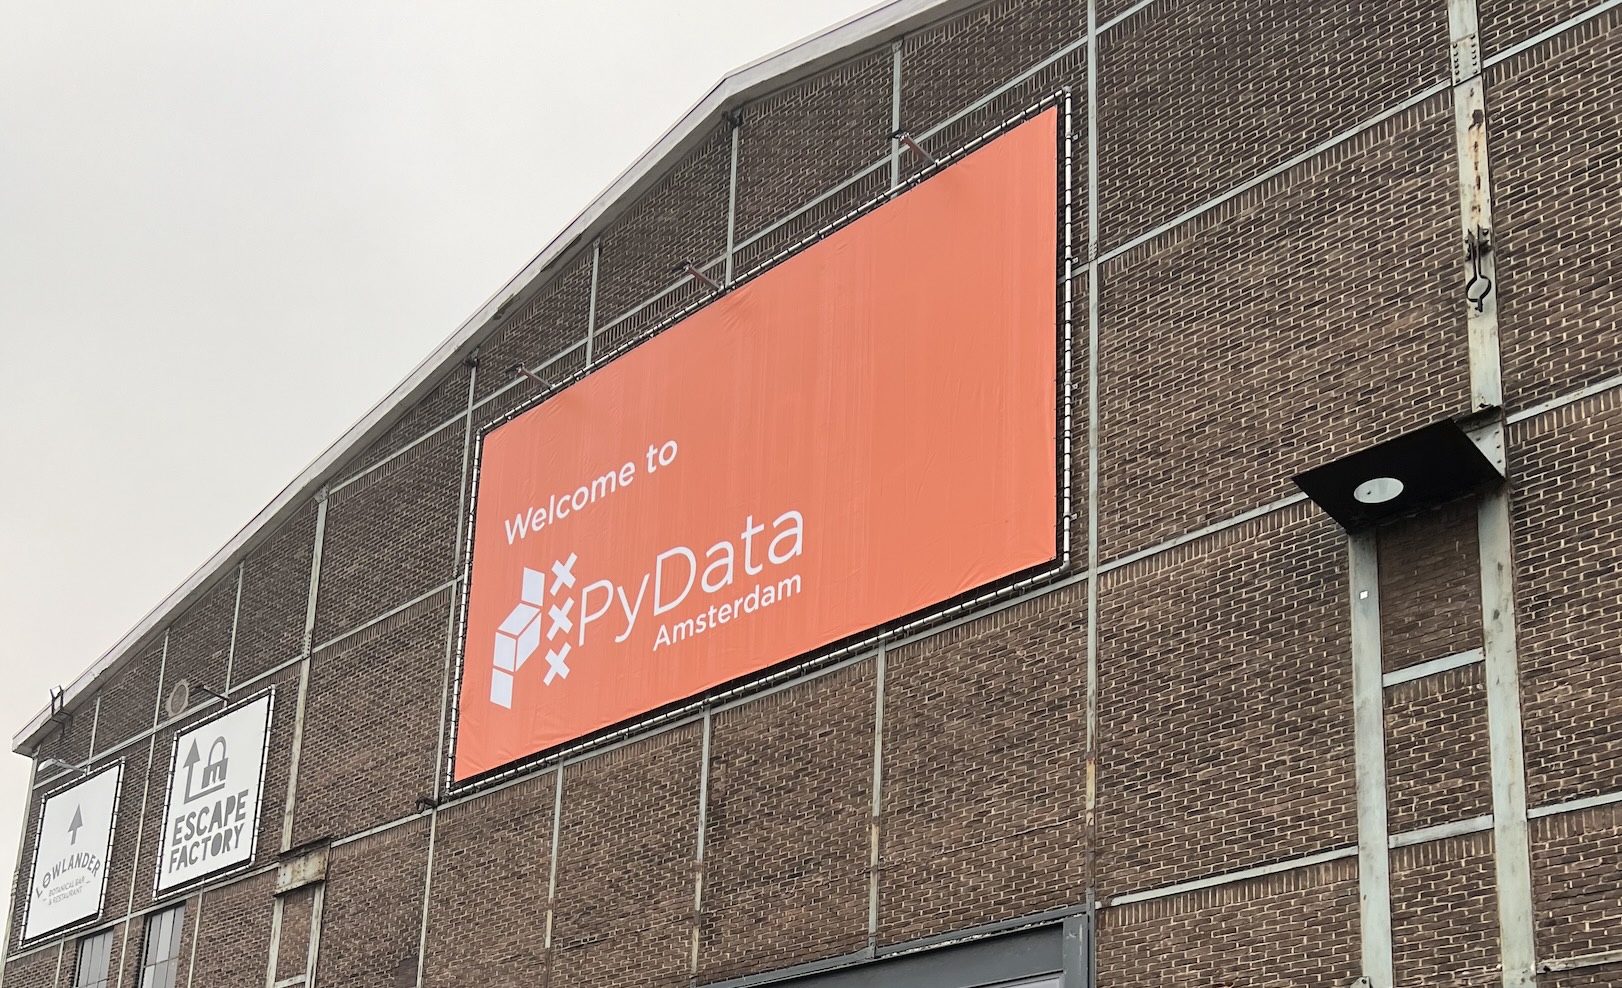
This week I spent a few days attending PyData Amsterdam. I initially thought it would be three days (as it said on my ticket), but it turned out that I only had access for two days. In the grand scheme of things, it turned out to be good as my week was a lot more busy than initially planned. And if the choice is between two fully packed days or three more relaxed days, I would go with the former.
In brief, PyData Amsterdam 2024 was a great conference and in this post I will share a few random notes and thoughts. The event took place in the De Kromhouthal in Amsterdam-Noord. I like to visit the north of Amsterdam, especially when I can take the ferry on a sunny day, but I would not want to live there. Despite all the options, it just feels – despite the ferry – too disconnected from the rest of Amsterdam. For a conference, however, this can even be a good thing and the location was great.
It goes without saying that I do not primarily go to conferences to socialise and meet people. However, I should mention that I got to talk to a lot of smart and friendly people, especially data scientists and ML/data/software engineers, and I was generally satisfied with the vibe of the conference and how inclusive it was.
The two days were packed and I did not skip any time slots. That is, I went to a session whenever possible. It was relatively easy to find specific sessions I would like to attend. In general, I tried to avoid anything primarily related to GenAI (not because I do not find it interesting, but because I encounter so much material related to that in my day-to-day life at the moment). Here are the talks/presentations I attended Thursday (in chronological order):
- Keynote: Open-source Multimodal AI in the Wild
- Understanding Polars Expressions when you’re used to pandas
- Polars 1.0 and beyond
- Building a Data Platform from scratch
- From language to marketing: RNNs for data-driven multi-touch attribution at Booking.com
- Almost Perfect: A Benchmark on Algorithms for Quasi-Experiments
- Data Science for Social Good: Making Impact in Resource-Constrained Environments
- How Dimensional is a `pandas.DataFrame`, anyway?
And here are the talks/presentations I attended Friday:
- Keynote: Applied NLP in the age of Generative AI
- Boosting AI Reliability: Uncertainty Quantification with MAPIE
- Causal Effect Estimation in Practice: Lessons Learned from E-commerce & Banking
- How I hacked UMAP and won at a plotting contest
- How Research Teams Can Deliver Higher-Quality Insights Faster
- Uncertainty quantification: How much can you trust your machine learning model?
- From mocking to rocking your tests with testcontainers
- Debugging as an experimental science
- Keynote: The Art of Language: Mastering Multilingual Challenges in LLMs
In addition, I also attended some lightning talks. These can be a bit more hit and miss, but that does not really matter. If you do not find a lightning talk interesting, there will be another one coming up in a minute and you have a good excuse to catch up on Slack. I liked the lightning talk on a data visualisation called The Fellowship of Kaggle as well as the talk by James Powell (there is a certain irony to his presentations… the less I understand, the more I get out of them).
Several sessions I attended were about polars. While I primarily use Pandas, I can see a lot of good reasons to get into Polars, especially with the release of a stable version (1.0). I found the talk by the creator of Polars, Ritchie Vink, very interesting, in particular the considerations related to the development of the API. I also enjoyed the talk by Jeroen Janssens on data visualisation of dimensionality reduction with UMAP and related topics (e.g., his ongoing work on the book about Polars).
The keynote by Ines Montani touched upon topics related to the productionisation of GenAI, which was neither too optimistic or too pessimistic, but the right fit between the two – i.e., constructive. For an example, check out the post on the window-knocking machine test. In general, the keynotes all related to various aspects of AI, but without any of them being symptomatic of the typical LLM hype.
It goes without saying that I enjoyed any session dealing with quasi-experiments, causal inference and uncertainty quantification. One great presentation dealt with using attention to attribution in marketing studies, and another covered the relevance of different causality models (a topic reminiscent of a blog post I wrote years ago). The session on uncertainty quantification covered the scikit-learn-compatible module MAPIE with a particular focus on conformal predictions (something I have been trying out in the context of weighted averages of opinion polls).
Most of the presentations had a higher quality than what I have encountered at purely academic conferences over the years. I guess it boils down to the fact that discussions at academic conferences often, directly or indirectly, converge towards what it will take for a paper to be accepted in an academic journal, whereas a conference like PyData is – for obvious reasons – more related to tooling, programming and getting things done/putting code into production. Or, in other words, these years, I care a lot more about putting ‘code into production’ than ‘text into publication’.
Finally, I am a sucker for free stuff (maybe that is why I have always preferred open source), and on that note, it seems only fair to give a shout-out to the sponsor booths that provided everything from Streamlit socks to AI lakehouse beer and Tony’s Chocolonely. And of course a bunch of stickers, which I – for the most part – cannot get myself to put on my laptop (you will never see me with an R or Python or Julia sticker on my laptop).
In sum, PyData Amsterdam 2024 was a success. 8.4 out of 10.