In political science, some of the data we use is from international databases such as the World Bank, ILOSTAT, OECD, WHO and Eurostat. One possibility to access data from these sources is to manually download data from their webpages. This is, however, often time-consuming and not an efficient way to obtain data.
Luckily, there are easier ways to access international statistics. In this post, I will show you have to get data from the World Bank, ILOSTAT, OECD, WHO, Eurostat and Our World in Data into R. The R packages available to access data are called WDI, Rilostat, OECD, WHO, eurostat and owidR, respectively. In brief, the packages make it easy for you to get the most recent data on a series of indicators into R.
To begin, while technically not required to obtain the data, load tidyverse (for the data management tools). Next, load the five packages mentioned above. Make sure to install the packages first (they are all, with the exception of owidR, available on CRAN).
# load relevant packages
## data management etc.
library("tidyverse")

## the five packages to access data
library("WDI")
library("Rilostat")
library("OECD")
library("WHO")
library("eurostat")
library("owidR")
The packages have some similarities. Specifically, there are two steps you need to go through. First, you will have to find the data you would like to use. Second, you will need to download the data. In the table below I outline the relevant functions for each step in the five packages.
| Package | Find data | Download data |
| WDI | WDIsearch() |
WDI() |
| Rilostat | get_ilostat_toc() |
get_ilostat() |
| OECD | search_dataset() |
get_dataset() |
| WHO | get_codes() |
get_data() |
| eurostat | get_eurostat_toc() |
get_eurostat() |
| owidR | owid_search() |
owid() |
You might not be sure what exact source to use. Instead, you will know what type of data you are looking for, e.g. data on unemployment. Accordingly, I find it useful to save the string of relevance (in this example unemployment) and search through the individual sources. Below, I search for unemployment in each data source and examine the output in the View window.
# finding data
## search string
searchText <- "unemployment"

## World Bank
searchText %>%
WDIsearch() %>%
View()

## ILOSTAT
ilostat_list <- get_ilostat_toc()
ilostat_list %>%
filter(str_detect(tolower(indicator.label), tolower(searchText))) %>%
View()

## OECD
oecd_list <- get_datasets()
search_dataset(searchText, data = oecd_list) %>%
View()

## WHO
who_list <- get_codes()
who_list %>%
filter(str_detect(tolower(display), tolower(searchText))) %>%
View()

## Eurostat
eurostat_list <- get_eurostat_toc()
eurostat_list %>%
filter(str_detect(tolower(title), tolower(searchText))) %>%
View()

## Our World in Data
searchText %>%
owid_search() %>%
View()
In the View() window you will get a list of the variables containing the search string in the label. Next to each of the labels you will see what the unique indicator id is for the variable. This is the information we will use to download the data.
In the World Bank and ILOSTAT, the indicator variable is called indicator. In the Our World in Data, the indicator variable is called chart_id. In OECD the indicator variable is called id and in WHO it is called label. For the unemployment rate in the World Bank data, for example, we can see that the indicator is SL.UEM.TOTL.ZS.
Using the code below, I download data from the various datasets. You can change the specific indicators to whatever data you would like to download.
# get data
## World Bank
data_worldbank <- WDI(indicator = "SL.UEM.TOTL.ZS")

## ILOSTAT
data_ilostat <- get_ilostat(id = "UNE_DYAP_NOC_RT_A")

## OECD
data_oecd <- get_dataset(dataset = "AVD_DUR")

## WHO
data_who <- get_data("tfr")

## Eurostat
data_eurostat <- get_eurostat("ei_lmhr_m")

## Our World in Data
data_owid <- owid("unemployment-rate")
We now have the data in our six objects (data_*). Usually, you want to restructure the data or link it to other datasets. This is where the functions in tidyverse come in handy.
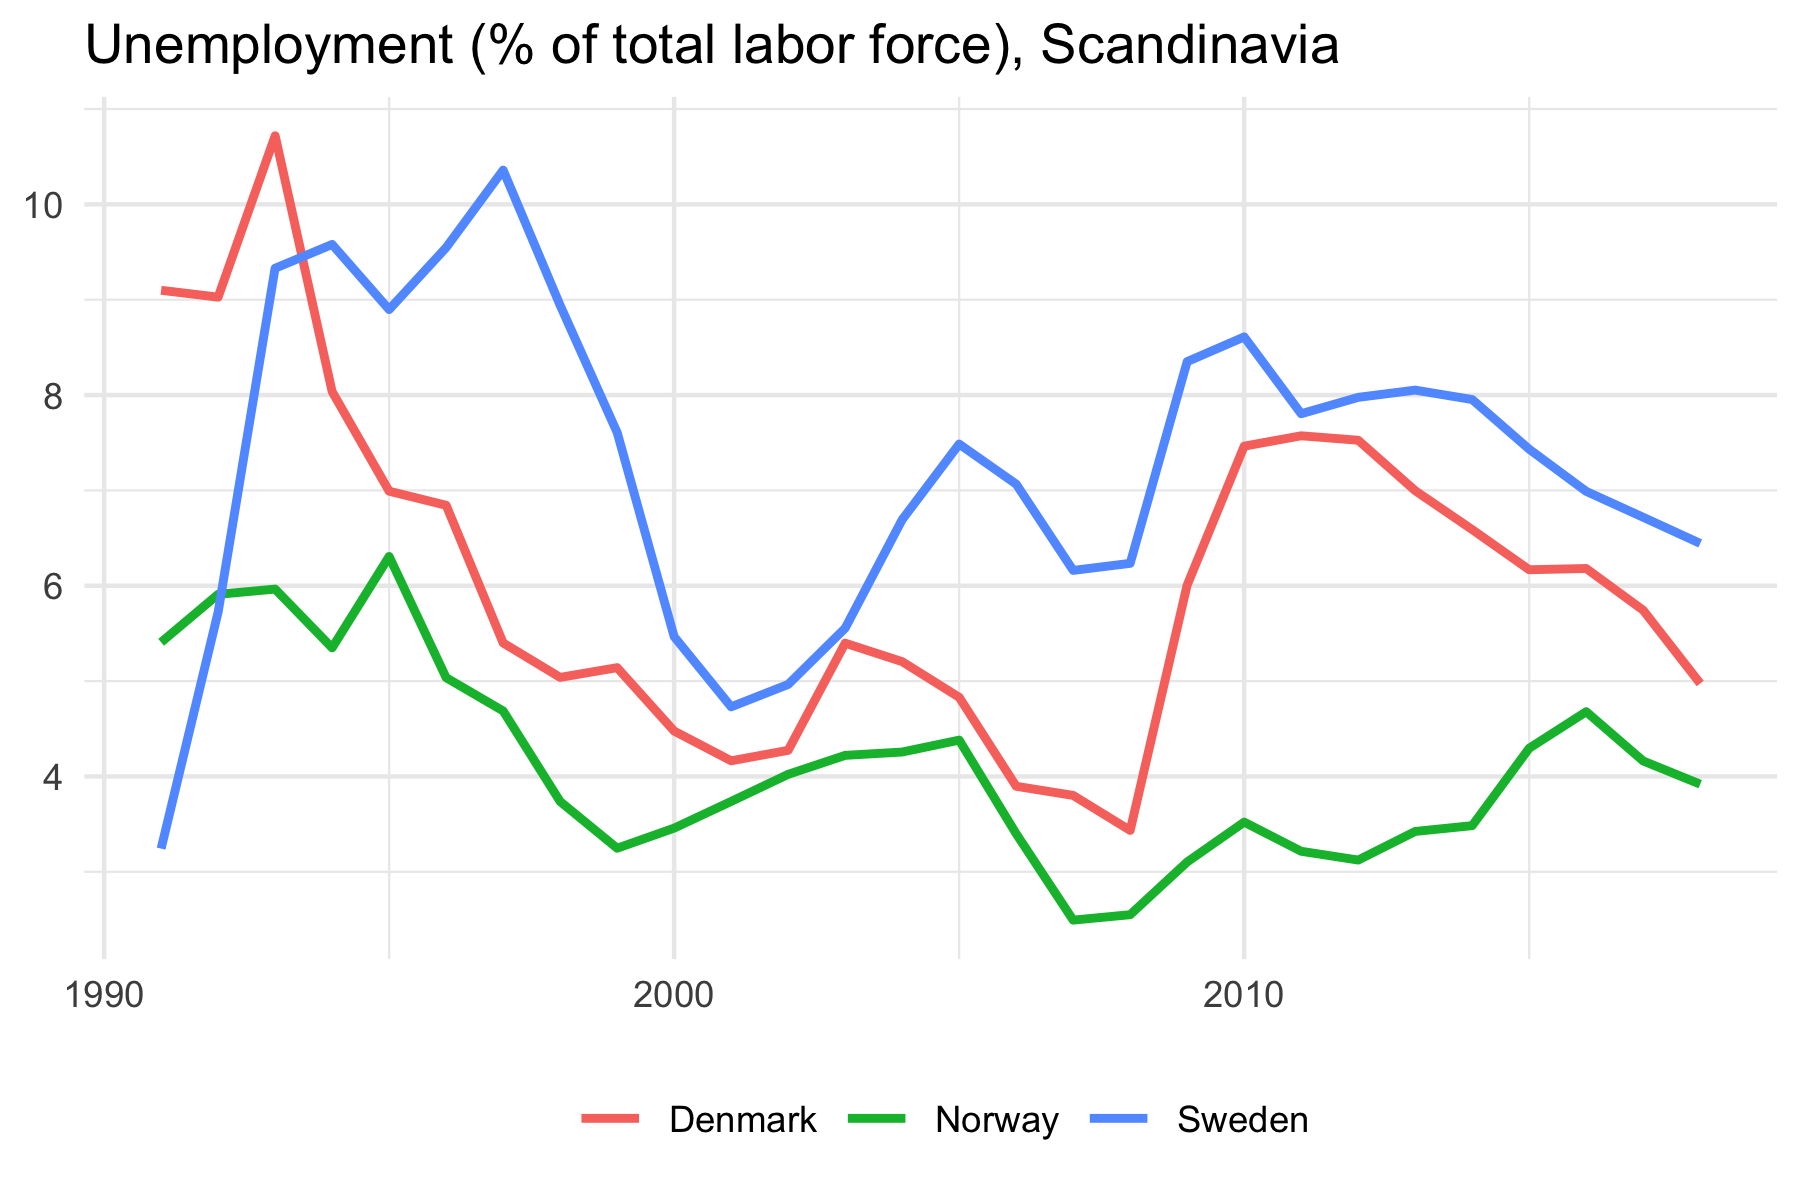
Using the data we got from the World Bank, we can show the unemployment rate in the Scandinavian countries:
# create figure
data_worldbank %>%
  drop_na(SL.UEM.TOTL.ZS) %>%
  filter(country %in% c("Denmark", "Norway", "Sweden")) %>%
  ggplot(aes(x = year, y = SL.UEM.TOTL.ZS, colour = country)) +
  geom_line(size = 1) +
  theme_minimal() +
  labs(title = "Unemployment (% of total labor force), Scandinavia",
       colour = NULL,
       y = NULL,
       x = NULL) +
  theme(legend.position = "bottom")
This is basically all you need to get data into R. Some of the packages have extra features that I recommend that you check out (e.g. the ability to download data on multiple indicators at once with the WDI() function).
Noteworthy, there are other packages that will help you get international statistics into R. The BIS package, for example, makes it possible to get data from the Bank for International Settlements into R. In this specific example, however, there are only few variables available and no need for a search string (for an example on getting data from BIS, I have updated the code on GitHub). Another example is the imfr package that enables you to get data from the International Monetary Fund (you can read more about this package here).
Last, there are a few principles that I recommend that you follow. First, only download the data you need. For some of the functions, you can specify the period and countries you want data from. This will ensure that you do not download the full data (e.g. WDI(country = c("DK", "NO", "SE"), indicator = "SL.UEM.TOTL.ZS")).
Second, only download the data once and save it in a local file. Instead of having one script where you both download and manipulate the data, consider having a script where you download and save the data and another script where you work with the data. There is simply no need to download the data again and again, especially if you run all of your code several times a day.
Changelog:
– 2021-09-16: Add Our World in Data (the owidR package) to the guide.
– 2020-05-13: Add note on the imfr package.
– 2019-10-08: Add note on other packages added, including an example with the BIS package.
– 2019-10-05: Add Eurostat (the eurostat package) to the guide.