People using {ggplot2} to visualise data often rely on other packages to enhance their ggplot2 objects. That is, there is a whole ecosystem of packages that can be used to expand and improve ggplot2 objects (from novel geometric objects to bespoke colour themes). So what are the most popular ggplot2 packages out there?
There are multiple resources you can consult to get an overview of ggplot2 extensions. An obvious place to start is the official ggplot2 extensions gallery. It is a great overview of 150 registered extensions. I have over the years maintained a GitHub repository with useful material for ggplot2 (though my repository also includes non-package resources). There is also a group of people working on mapping the ggplot2 ecosystem, and they are doing very interesting work these days (I shared my few thoughts on how I find new ggplot2 packages with the group here).
This brings me to an interesting set of numbers presented by Carlisle Rainey on the top 15 ggplot2 extensions by downloads during the last month. At the top of the list are packages such as {cowplot}, {ggrepel}, {patchwork}, and {ggpubr} (the code used to get the numbers is available here). It is not reported in the script but I assume it is the list of the 150 extensions from the ggplot2 extensions gallery that is being examined here. This is fine but it also excludes some popular ggplot2 packages (e.g., {ggmap}) and includes packages that have not been updated for many years or are not on CRAN (e.g., {ggpirate}).
In this post, I will present my own take on how to make a list of the most popular ggplot2 packages. However, I should say upfront that I have some rather extreme views on how I define a ggplot2 package. The point here is not to create an authoritative ranking of the most popular ggplot2 packages, but to formulate my own views on how I would define and rank the popularity of ggplot2 extensions.
First, I believe looking at CRAN downloads is a good proxy for popularity. It is not perfect to only look at packages available on CRAN (a point I also made last year in my overview of ggplot2 themes), but it gives reliable behavioural data on popularity. Similar to Carlisle Rainey, I will use downloads from the past month using cranlogs::cran_downloads(when = "last-month").
Second, it is not sufficient for me that a package says it is a ggplot2 extension. I am less interested in whether a ggplot2 package has “gg” in its name and more interested in whether the package provides functions that make it easy for me to directly improve my ggplot2 objects (without having to dig deep into the code to get it to work). In practice, this means that I want a ggplot2 extension to comply with the principle of “the grammar of graphics”.
Consider, for example, the package {ggstatsplot}. The package has “gg” in its name and the description makes it sound very much like a package that fits nicely into the ggplot2 ecosystem: “{ggstatsplot} is an extension of {ggplot2} package for creating graphics with details from statistical tests included in the information-rich plots themselves.” However, this package does not align with the grammar of graphics principles but provides high-level functions such as ggbetweenstats() and ggcorrmat(). These functions, as beautiful as the objects they return might be, aim to replace ggplot2::ggplot() rather than expand upon it.
A ggplot2 extension should introduce low-level graphics functions that you can apply directly on your ggplot2 object, and preferably complies with the function naming in {ggplot2}, i.e., functions that begin with geom_*, theme_*, coords_*, etc. I acknowledge that this is an extreme view, and I will give an obvious example of a limitation below, but this is how I believe a ggplot2 package – as a minimum – provides an extension to {ggplot2}.
Next, a package is not a 0% ggplot2 package or a 100% ggplot2 package. For example, the package {jmvcore} provides four ggplot2 themes (theme_default, theme_hadley, theme_min, theme_spss), but also a lot of functions that are not related to ggplot2. We should consider the package as part of the ggplot2 ecosystem, but not consider it a 100% ggplot2 package. Ideally, we would be able to see how many downloads of the package were linked to these functions, but that is not a possibility.
My approach to ranking the popularity of ggplot2 packages is to weight the number of package downloads by the number of ggplot2 functions in the package. In other words, I will take the number of downloads of a package and multiply by the proportion of ggplot2 functions in the package (to get the average number of downloads for a ggplot2 function in a package). Again, this is not a perfect approach, but it is better than simply assuming that a package is actually an extension to ggplot2::ggplot().
For example, if you run getNamespaceExports("ggfittext"), you will see that there are two functions in the namespace of this package, geom_bar_text() and geom_fit_text(). This makes me believe that everybody downloading this package from CRAN will use this package as a ggplot2 extension. If you take a package like {trekcolors}, you will see that eight out of the 18 functions in the package are ggplot2 functions, but this also means that I am less certain that all downloads of this package will be used with {ggplot2}. It could be more, and it could be less, but there is (currently) no way of knowing.
In my overview of ggplot2 packages, I am able to identify 183 packages that have at least one low-level function that comply with the grammar of graphics (not including {ggplot2}). For each of these packages I take the proportion of ggplot2 functions (relative to the total number of functions in the package) and multiply with the number of CRAN downloads within the recent month. This provides a measure of downloads per ggplot2 function in a package.
In the figure below we see the top 25 packages. {ggsignif} provides nothing but ggplot2 low-level functions and it is a very popular package. {ggsci} provides a lot of ggplot2 functions, but several functions in the package can also be used outside ggplot2 (see, e.g., here). Again, we get the downloads per ggplot2 function, but this is not to say that most – if not all – downloads are directly related to the specific ggplot2 functions in the package.
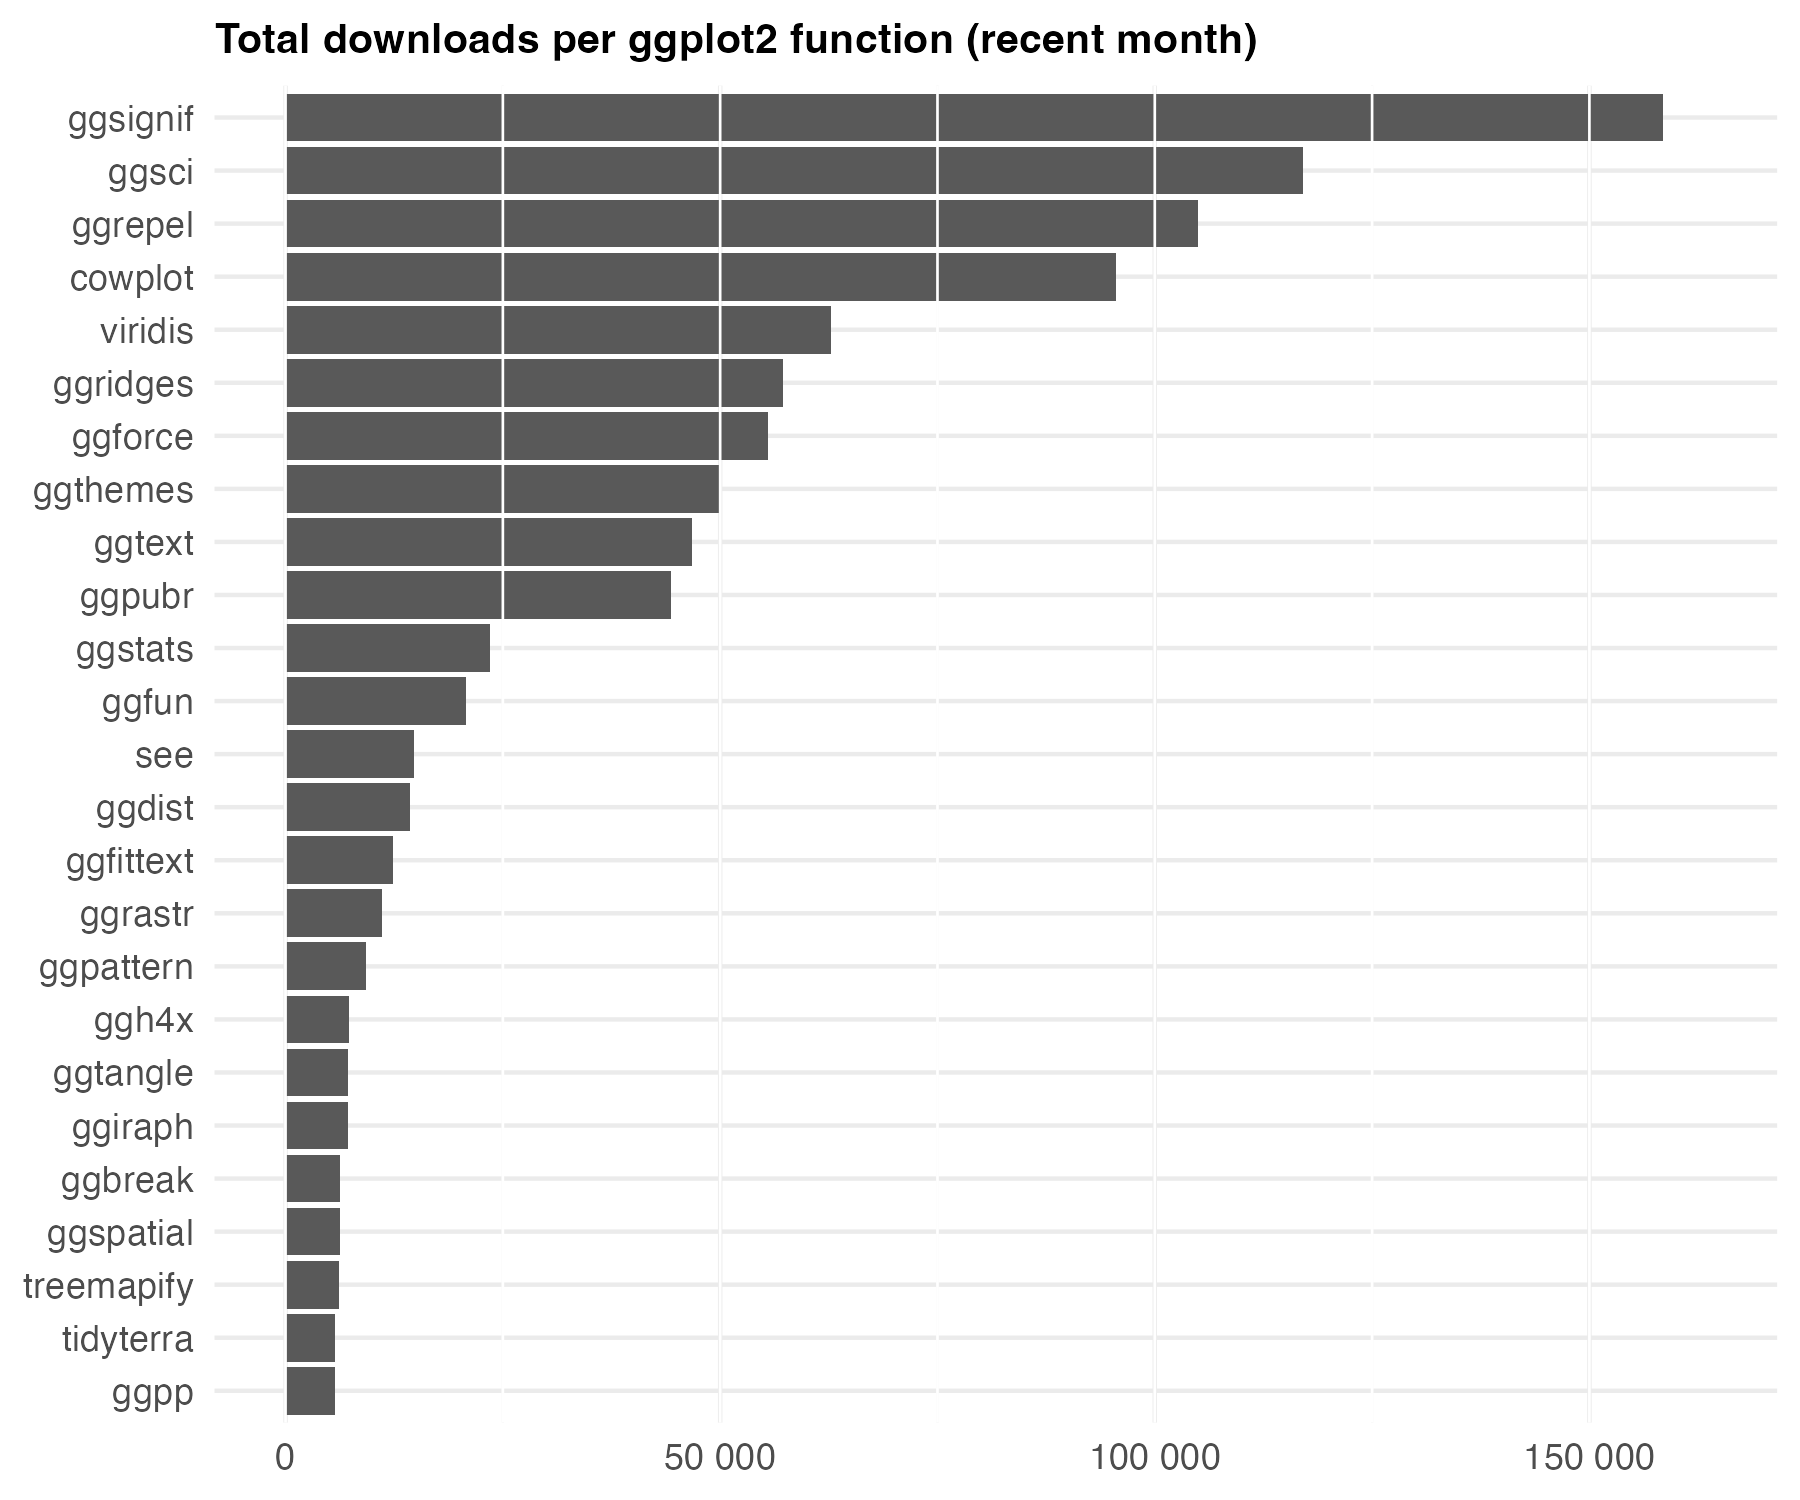
There are some interesting packages on the popularity ranking. For example, {viridis} is not part of the ggplot2 extensions gallery, but three out of the 13 functions in the package are ggplot2 functions. This package is very popular on CRAN and this is enough to bring it into the list. Should it be part of the ranking? I can see a strong argument for why not, but I am happy to include it here.
The obvious limitation is that this only includes extensions to ggplot2::ggplot(), and not packages that make it easy to work with multiple ggplot2 objects, such as {patchwork}. This package is one of the best ggplot2 packages out there (if not the best), but is not included above due to the very strict inclusion criteria. I could have made an exception for packages like these, but I would rather see this package as an exception.
There are many ways one can look at the popularity of ggplot2 packages, in particular ways to rank the different packages. The above ranking is my preferred method, but I am curious to see how others will address this particular issue.