In this post I will provide an overview of the categories of complete themes available for ggplot2, the best data visualisation package available for R, bar none. By complete themes I mean functions with the prefix theme_* available in CRAN packages used to customise your ggplot2 plot. In other words, I only consider packages available on CRAN (e.g., it is not sufficient to be available on GitHub or Bitbucket) and functions using the theme_* syntax to call the theme.
I have been going through a lot of packages that provide additional functionalities to {ggplot2}, especially when working on my GitHub repository awesome-ggplot2 over the years. A lot of these packages provide customised themes that can make it easier to obtain a beautiful ggplot2 object without having to dig into the various options available in ggplot2::theme().
In total, for this post, I have looked into 153 functions available in 56 CRAN packages. In doing this, I have identified eight categories of theme functions. These categories are not necessarily mutually exclusive, but they are – at least in my view – useful in terms of understanding the customised theme landscape for ggplot2. I will go through each of these eight categories before providing an overview of all functions I have encountered. If I have missed anything, as always, please do feel free to reach out.
Category 1: Nothing
In the beginning, there was nothing. In the ggplot2 package, you will find theme_void(), that is a completely empty theme. There are several themes available in the CRAN packages providing similar themes.
Most noteworthy is the theme function theme_nothing() that is provided in four different packages, namely {cowplot}, {ggfun}, {ggimage}, and {ggmap}. This is, alas, not the only theme function that is available across multiple packages, and I would prefer if theme functions did not overlap between different packages. In other words, if you develop your own ggplot2 theme, please make sure that the function name is not already taken by another theme in another package available on CRAN and beyond.
Of course, the themes that provide ‘nothing’ does not remove everything – only as many of the theme options as possible for there to be nothing left but the geometrics and aesthetics of the visualisation. Similar themes are available in functions such as theme_blank() in {ggnetwork}, theme_clean() in {ggiraphExtra} and theme_transparent in {ggpubr}.
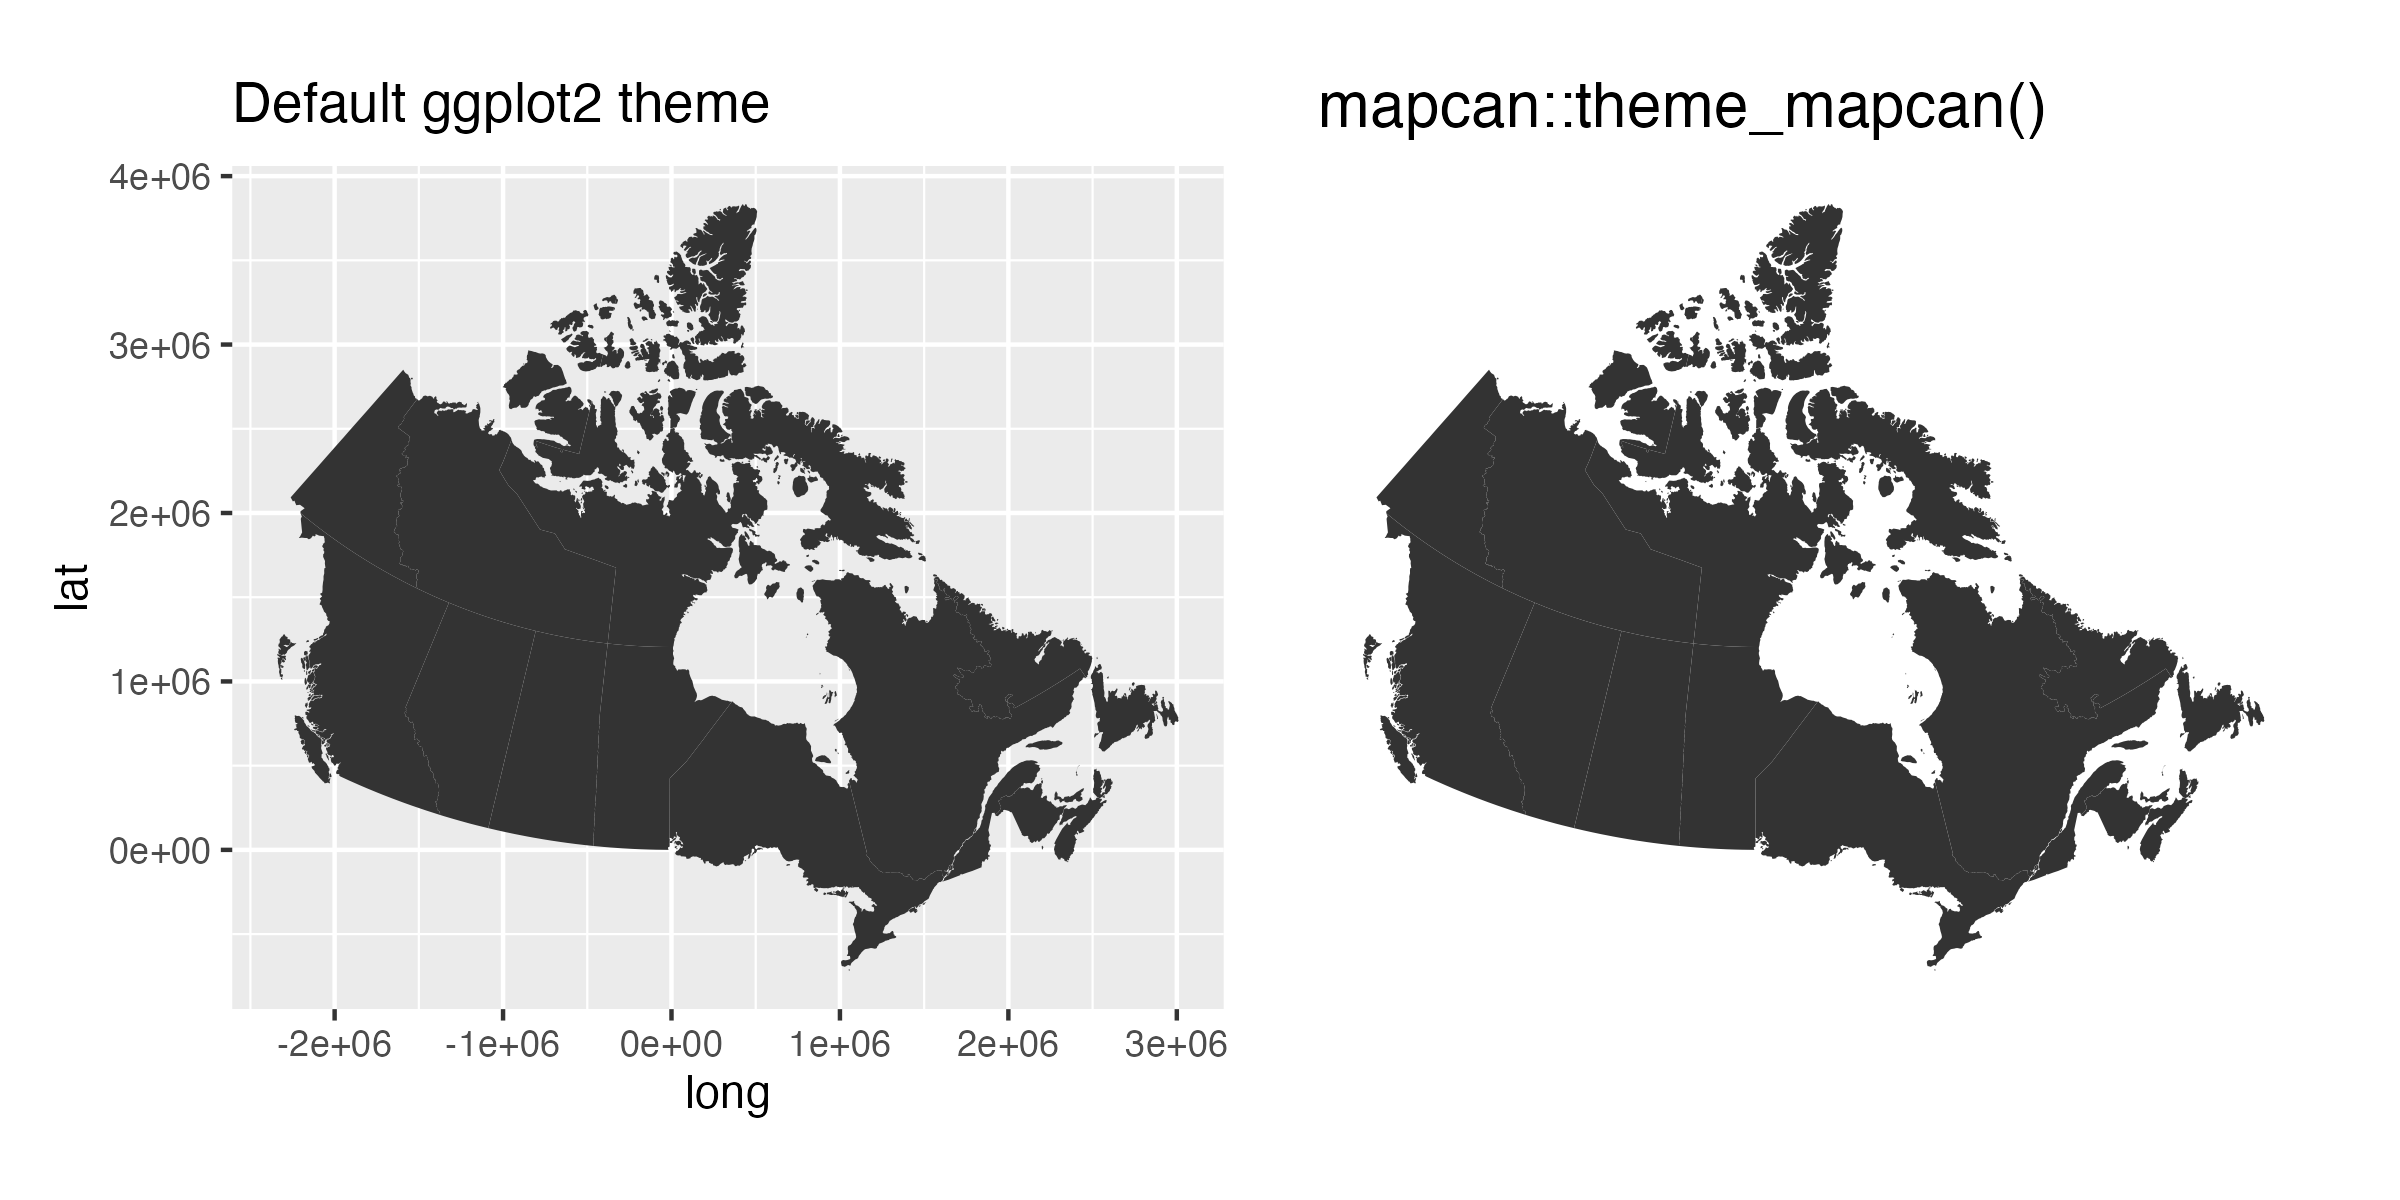
Most of the ’empty’ themes are related to specific plot types. For example, when you want to visualise geospatial data, it is good to have the option to keep it simple. Accordingly, packages used to show maps have such empty themes, e.g., theme_white_f() in {ggswissmaps} and theme_mapcan in {mapcan}. Below I show an example of how theme_mapcan() removes all default features from a ggplot2 object.
There are multiple examples of such theme functions that basically do ‘nothing’, and are functionally and conceptually similar to theme_void(), including ggparliament::theme_ggparliament(), ggdag::theme_dag(), ggdendro::theme_dendro(), and ggsoccer::theme_pitch(). There is no real need to deal with all of these functions, and if all you need to do is to remove as much as possible from your ggplot2 dataviz, theme_void() will in most cases do the trick.
Category 2: Minimalist
One of my favourite default ggplot2 themes is theme_minimal(). While the theme is minimalist, there are several theme functions available for users looking for even more minimalist ggplot2 objects.
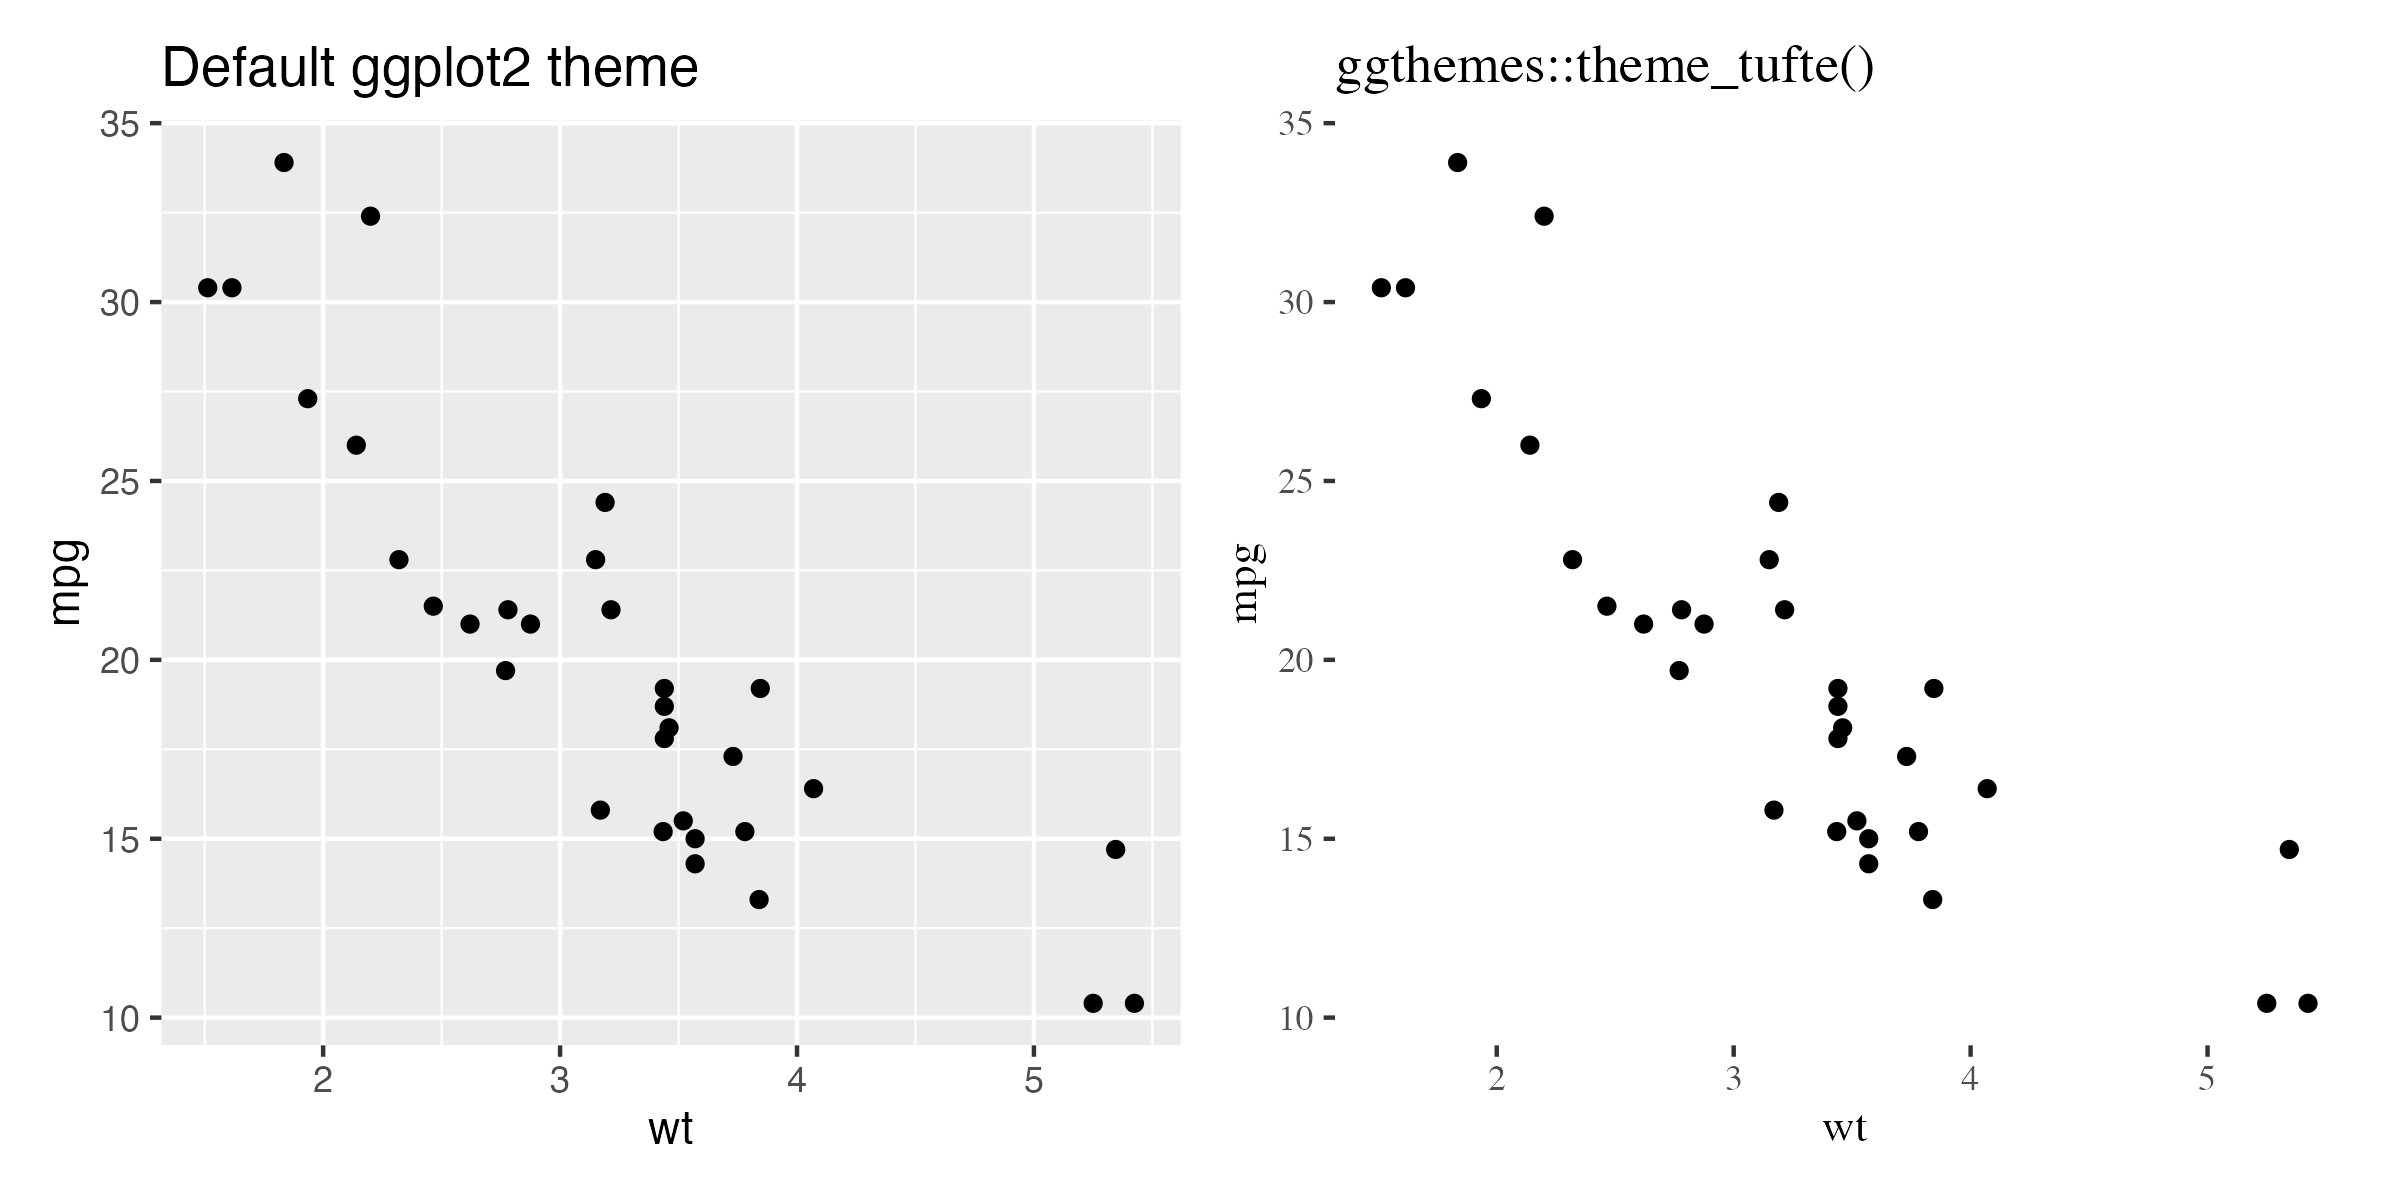
The inspiration for various minimalist themes is the work by Edward Tufte, and in particular the notion of the data-ink ratio, i.e., that we should use as little ink as possible to display our data. Specifically, we should remove as much ink (or as many non-background colour pixels) from our figures as possible and focus on what is important.
For example, consider the description of ggthemes::theme_tufte(), the ‘Tufte Maximal Data, Minimal Ink Theme‘: “Theme based on Chapter 6 ‘Data-Ink Maximization and Graphical Design’ of Edward Tufte The Visual Display of Quantitative Information. No border, no axis lines, no grids.” It is indeed easy to see how the theme removes the border, axis lines and grids when used.
The minimalist themes are popular as they remove a lot of default theme settings (such as the grey background colour) that are not needed in most cases. Accordingly, we can see a lot of themes that aim towards providing a minimalist theme in ggplot2, such as add2ggplot::theme_white(), ggfun::theme_transparent(), ggimage::theme_transparent(), and ggiraphExtra::theme_clean2().
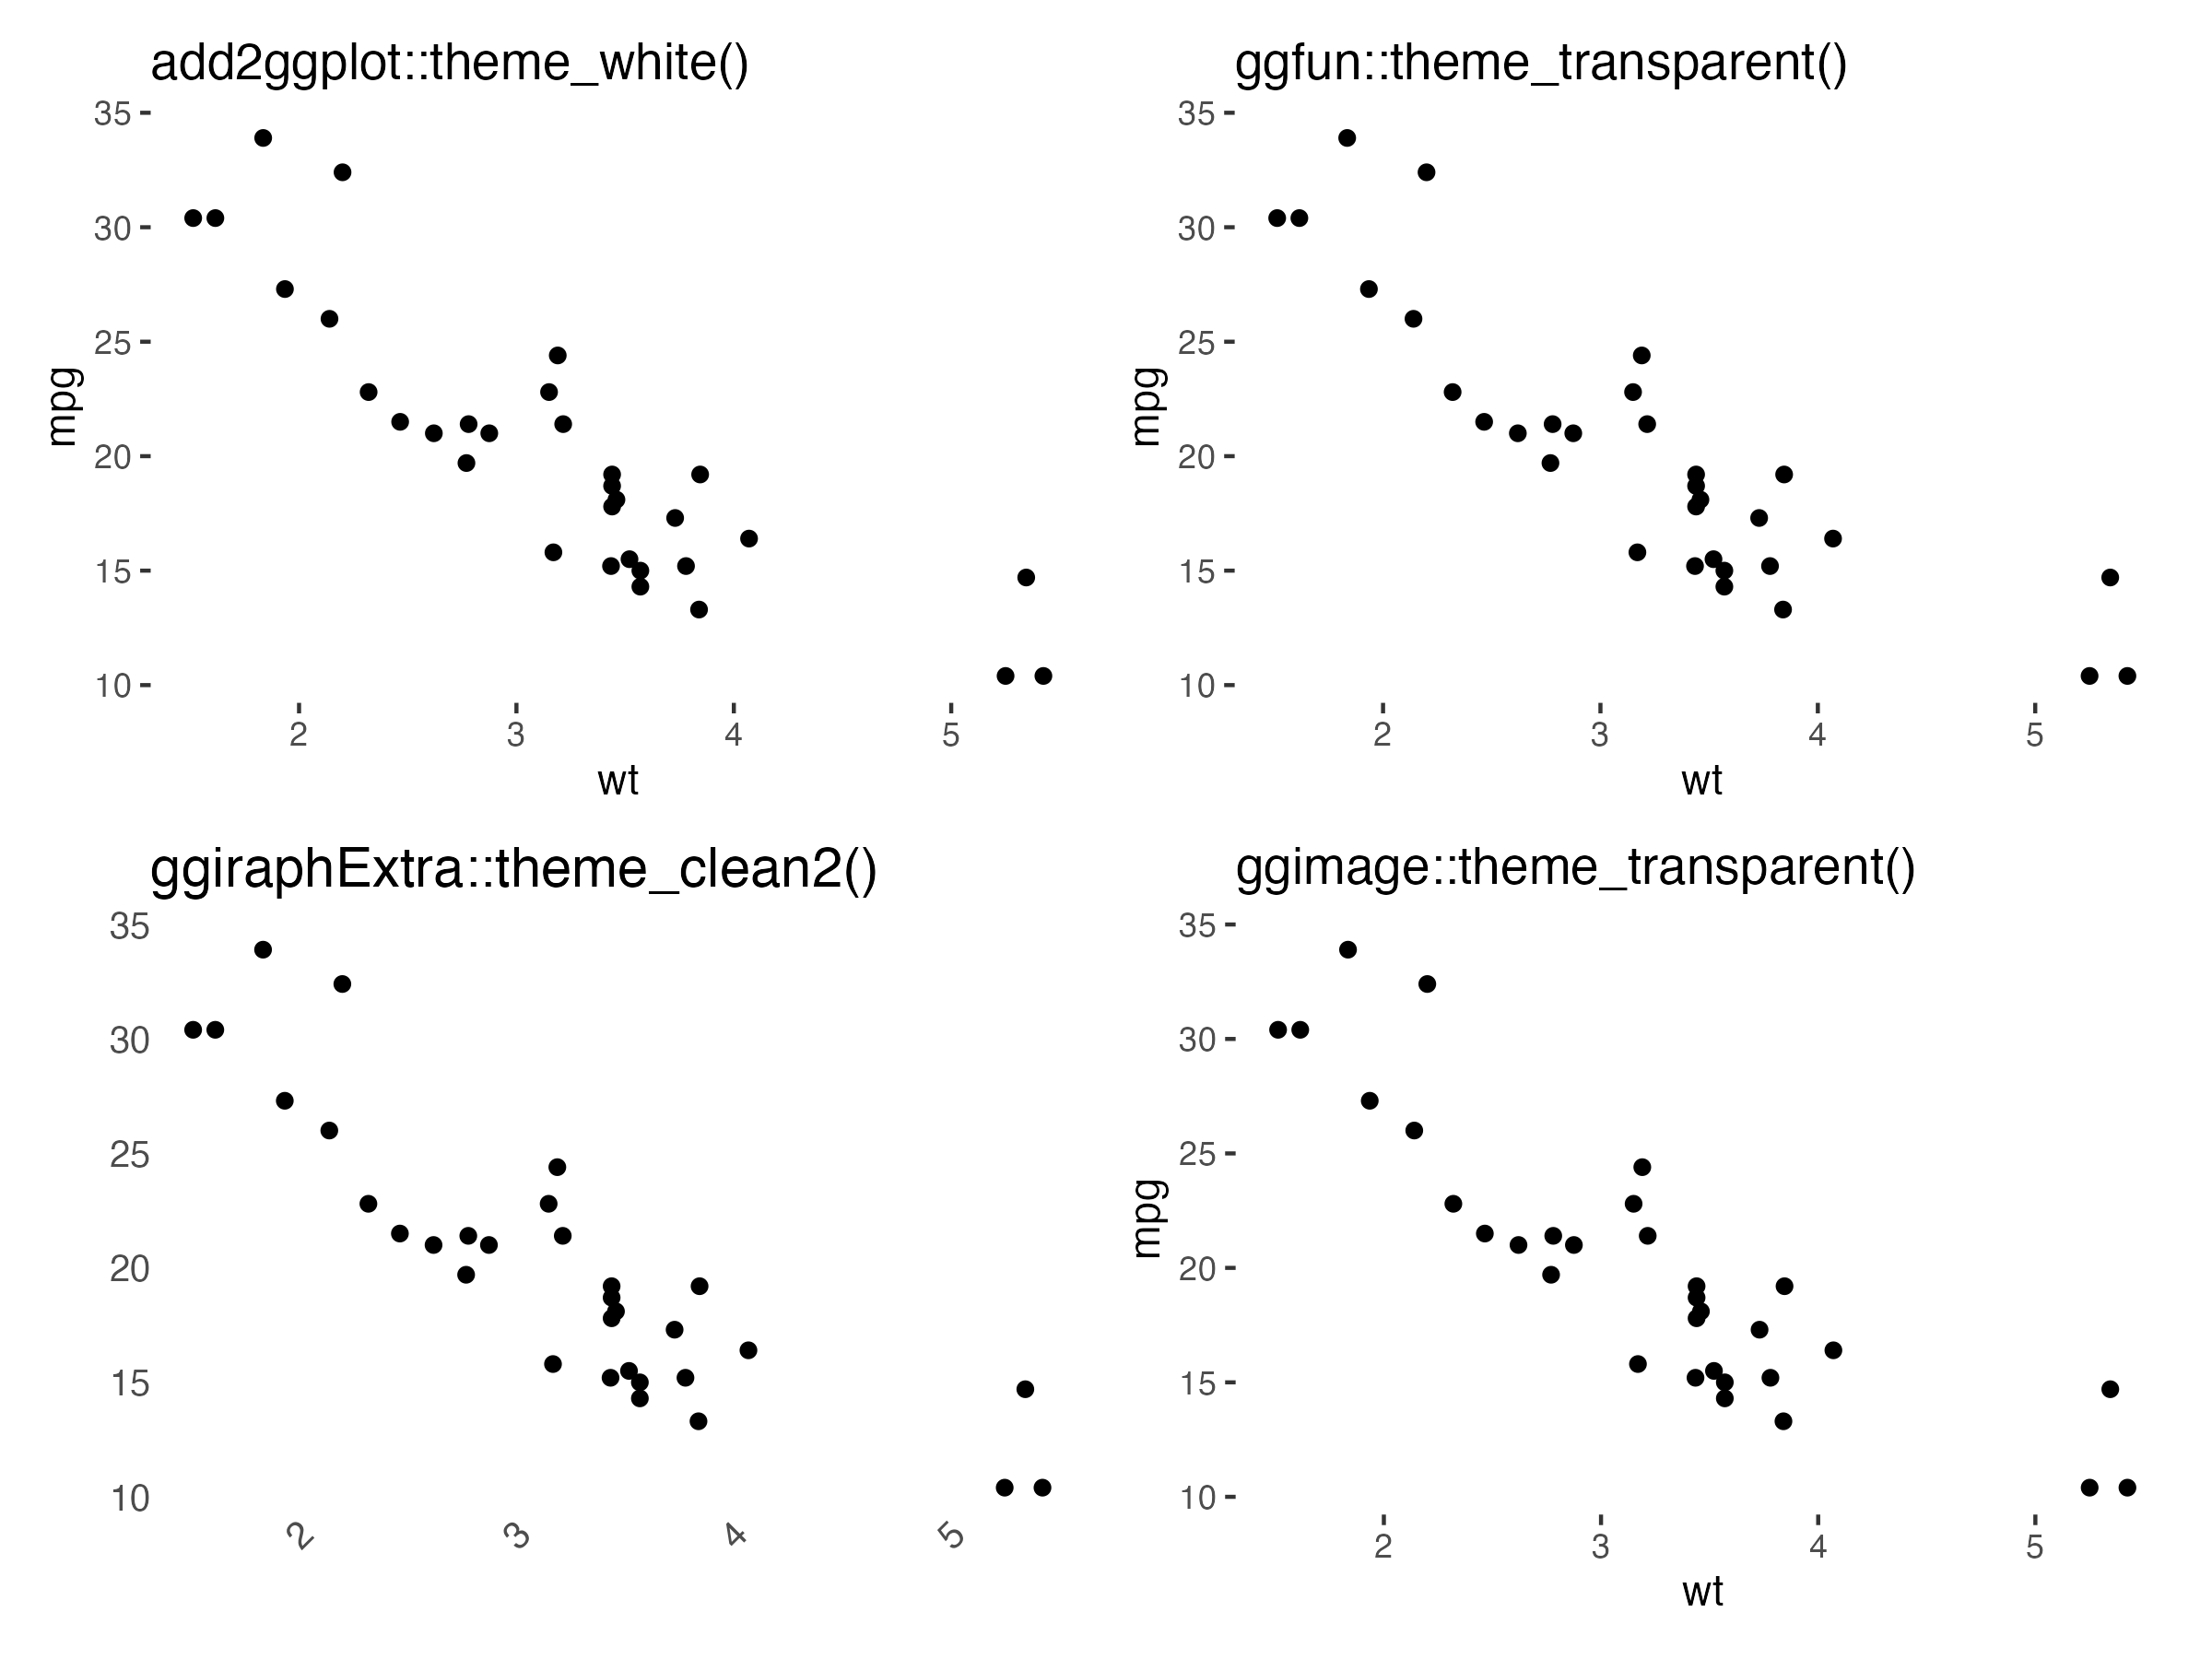
What we see with a minimalist theme is mostly about what we do not see. A good minimalist theme will have strong defaults that remove everything that is not needed to convey the signal in the visualisation, but nothing more. In other words, we can see the minimalist theme as a continuation of the ‘nothing’ themes, but with the addition of the core information required to understand and interpret the information (most often labels and axes information).
Category 3: Dark mode
While I do most of my R work in dark mode in my IDE, I rarely save figures with a dark theme. However, there are several dark themes available for ggplot2, in addition to ggplot2::theme_dark().
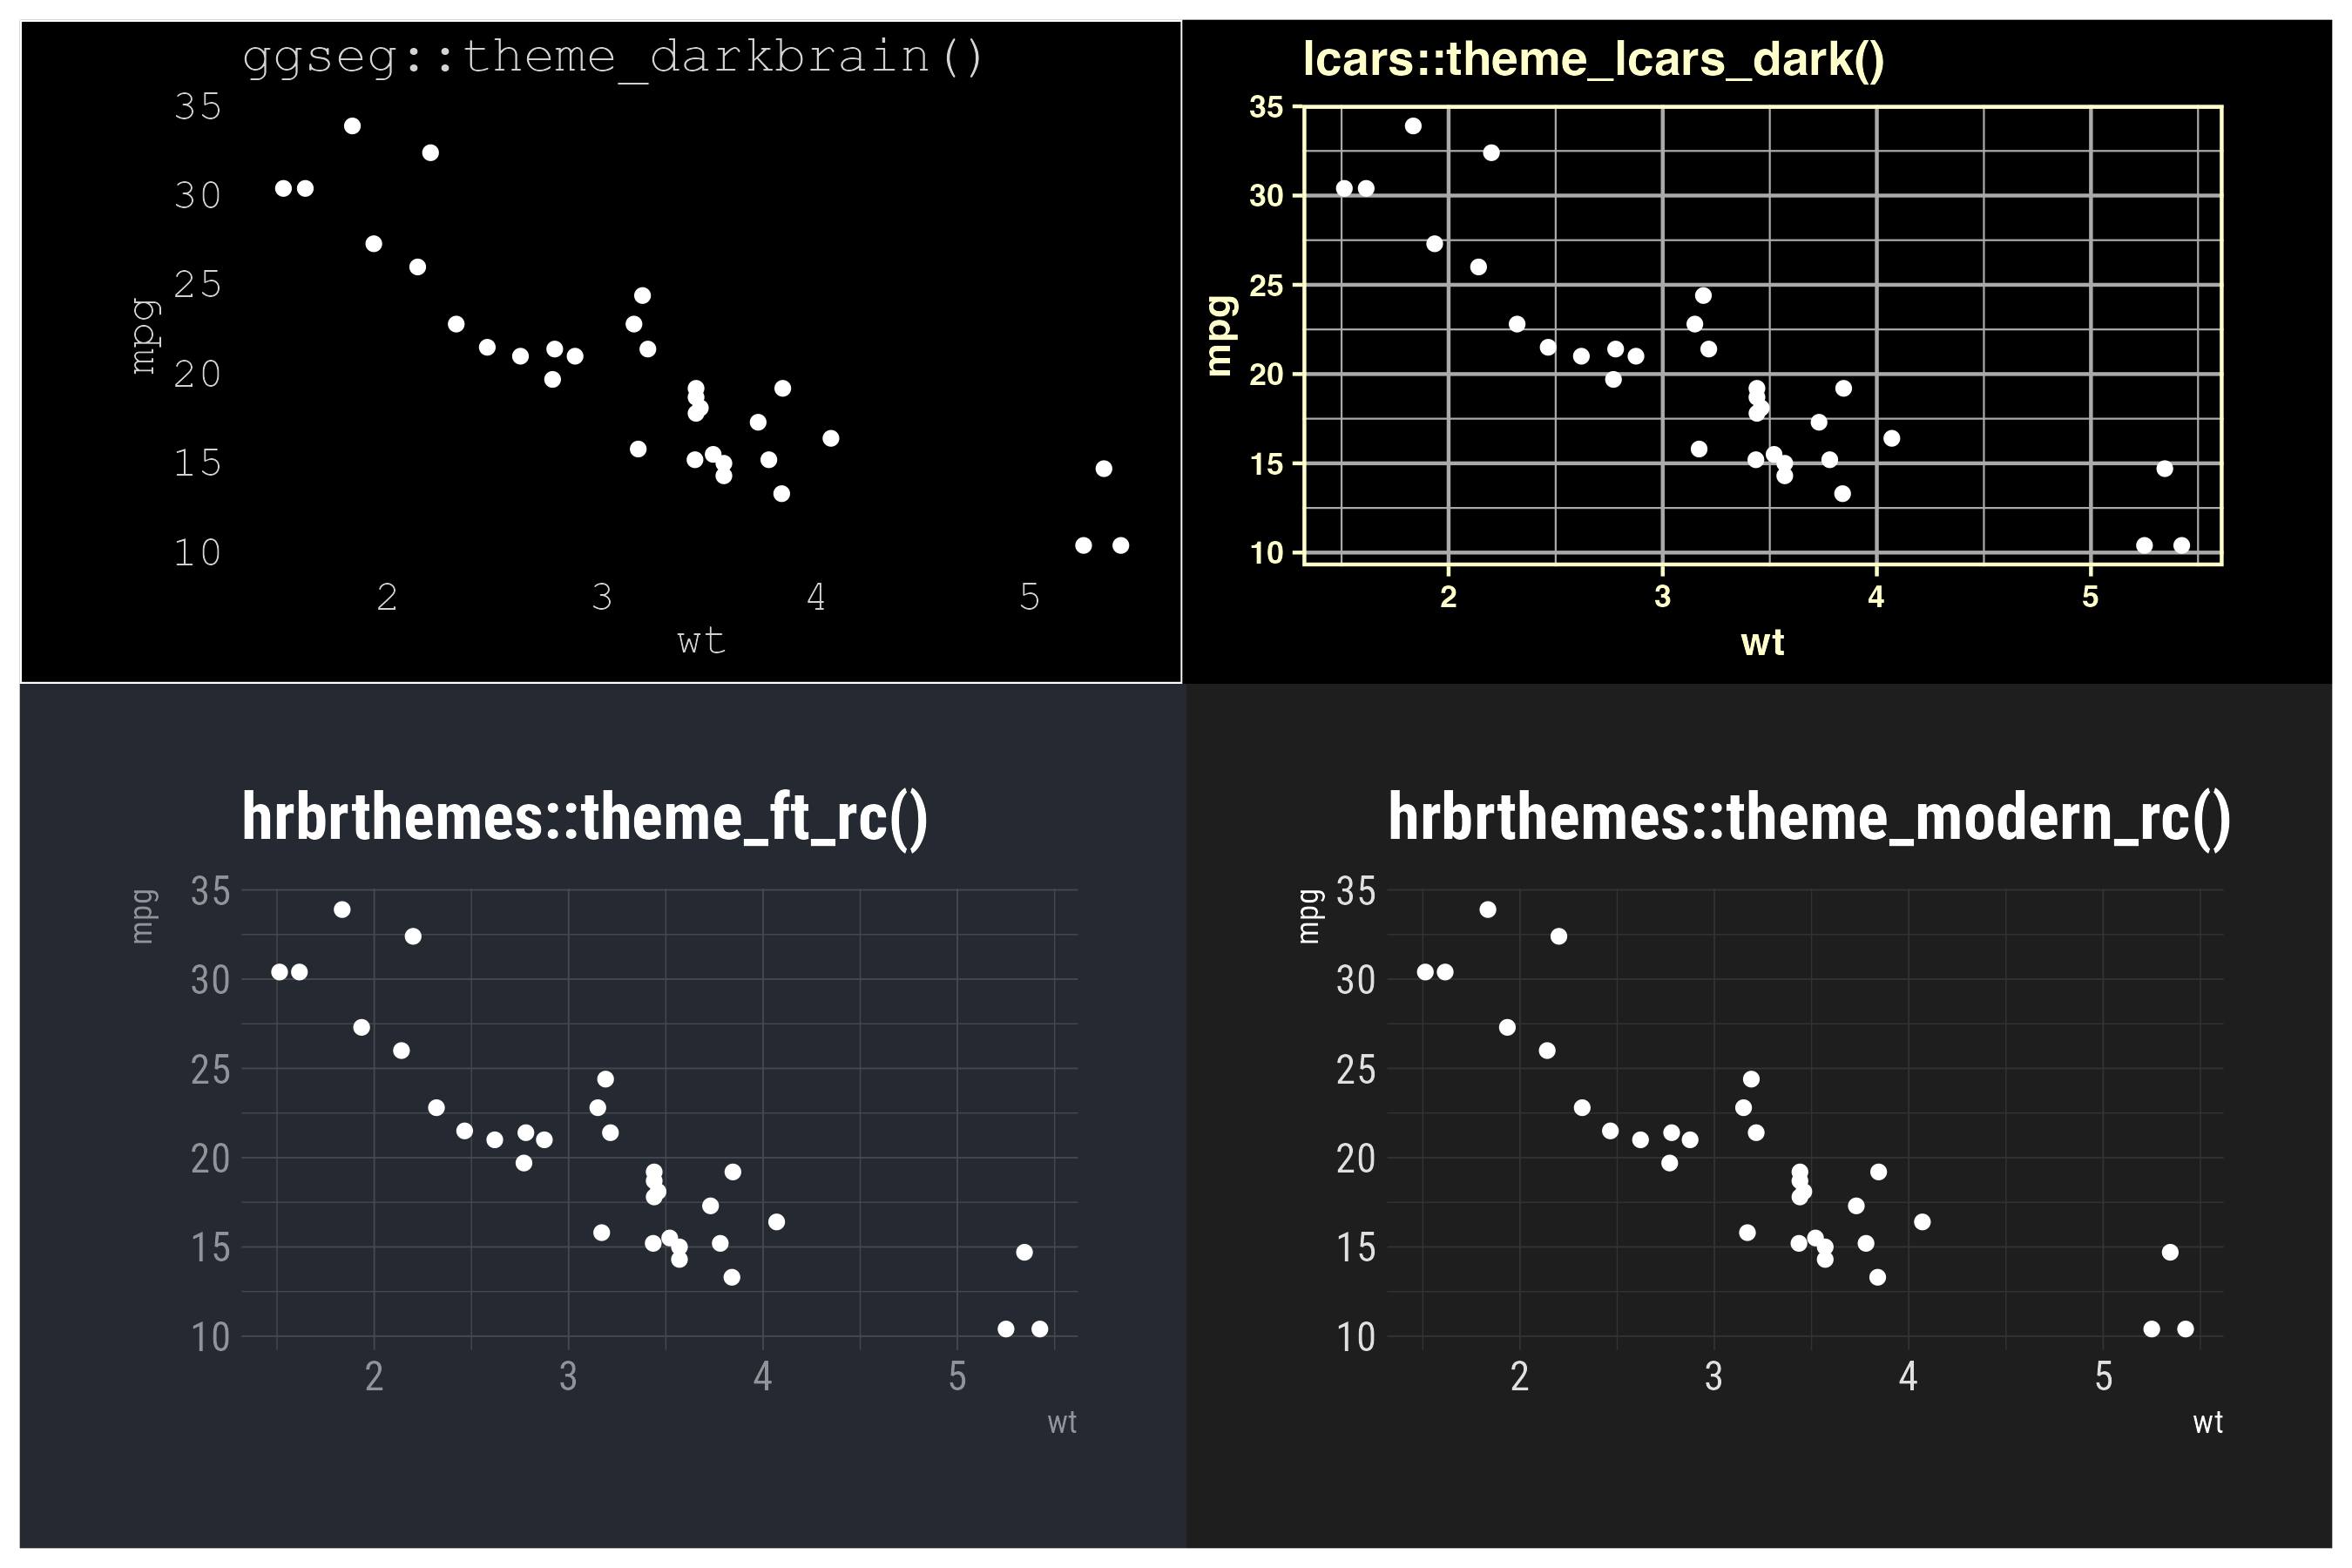
Some of these theme functions are shown in the figure below – i.e., ggseg::theme_darkbrain(), lcars::theme_lcars_dark(), hrbrthemes::theme_ft_rc(), and hrbrthemes::theme_modern_rc(). The themes differ in the colours and whatnot, but they are all very much dark.
Other noteworthy dark themes are theme_abyss(), theme_blackboard(), and theme_radar_dark() (all available in the package {see}). There is also a question about how dark a theme should be before it is a dark theme. I would not add, for example, add2ggplot::theme_grey_and_red() to the list of dark themes, but it is close.
I should also mention the package {ggdark} which I am not including here due to the syntax. That is, the package uses dark_* to provide dark variations of ggplot2 themes, e.g., dark_theme_bw(). However, if you are interested in dark themes to ggplot2, I can definitely recommend checking out the package.
Category 4: Popular culture
This is my least favourite category of ggplot2 themes. They tend to get a lot of attention on social media, most likely due to the juxtaposition of statistical programming and people’s favourite TV shows and movies. I am not against these themes per se, but they often require a lot more work to be useful, and even then, it is not always clear what the actual use case is.
In the figure below we look at four themes from the {tvthemes} package, namely theme_brooklyn99() (for Brooklyn Nine-Nine), theme_simpsons() (for The Simpsons), theme_rickAndMorty() (for Rick and Morty), and theme_parksAndRec() (for Parks and Recreation. Again, in these figures I only show the application of the theme function and not any other functions that be required to make the figures reflect the visual style of the respective TV series (in particular the font and various colours).
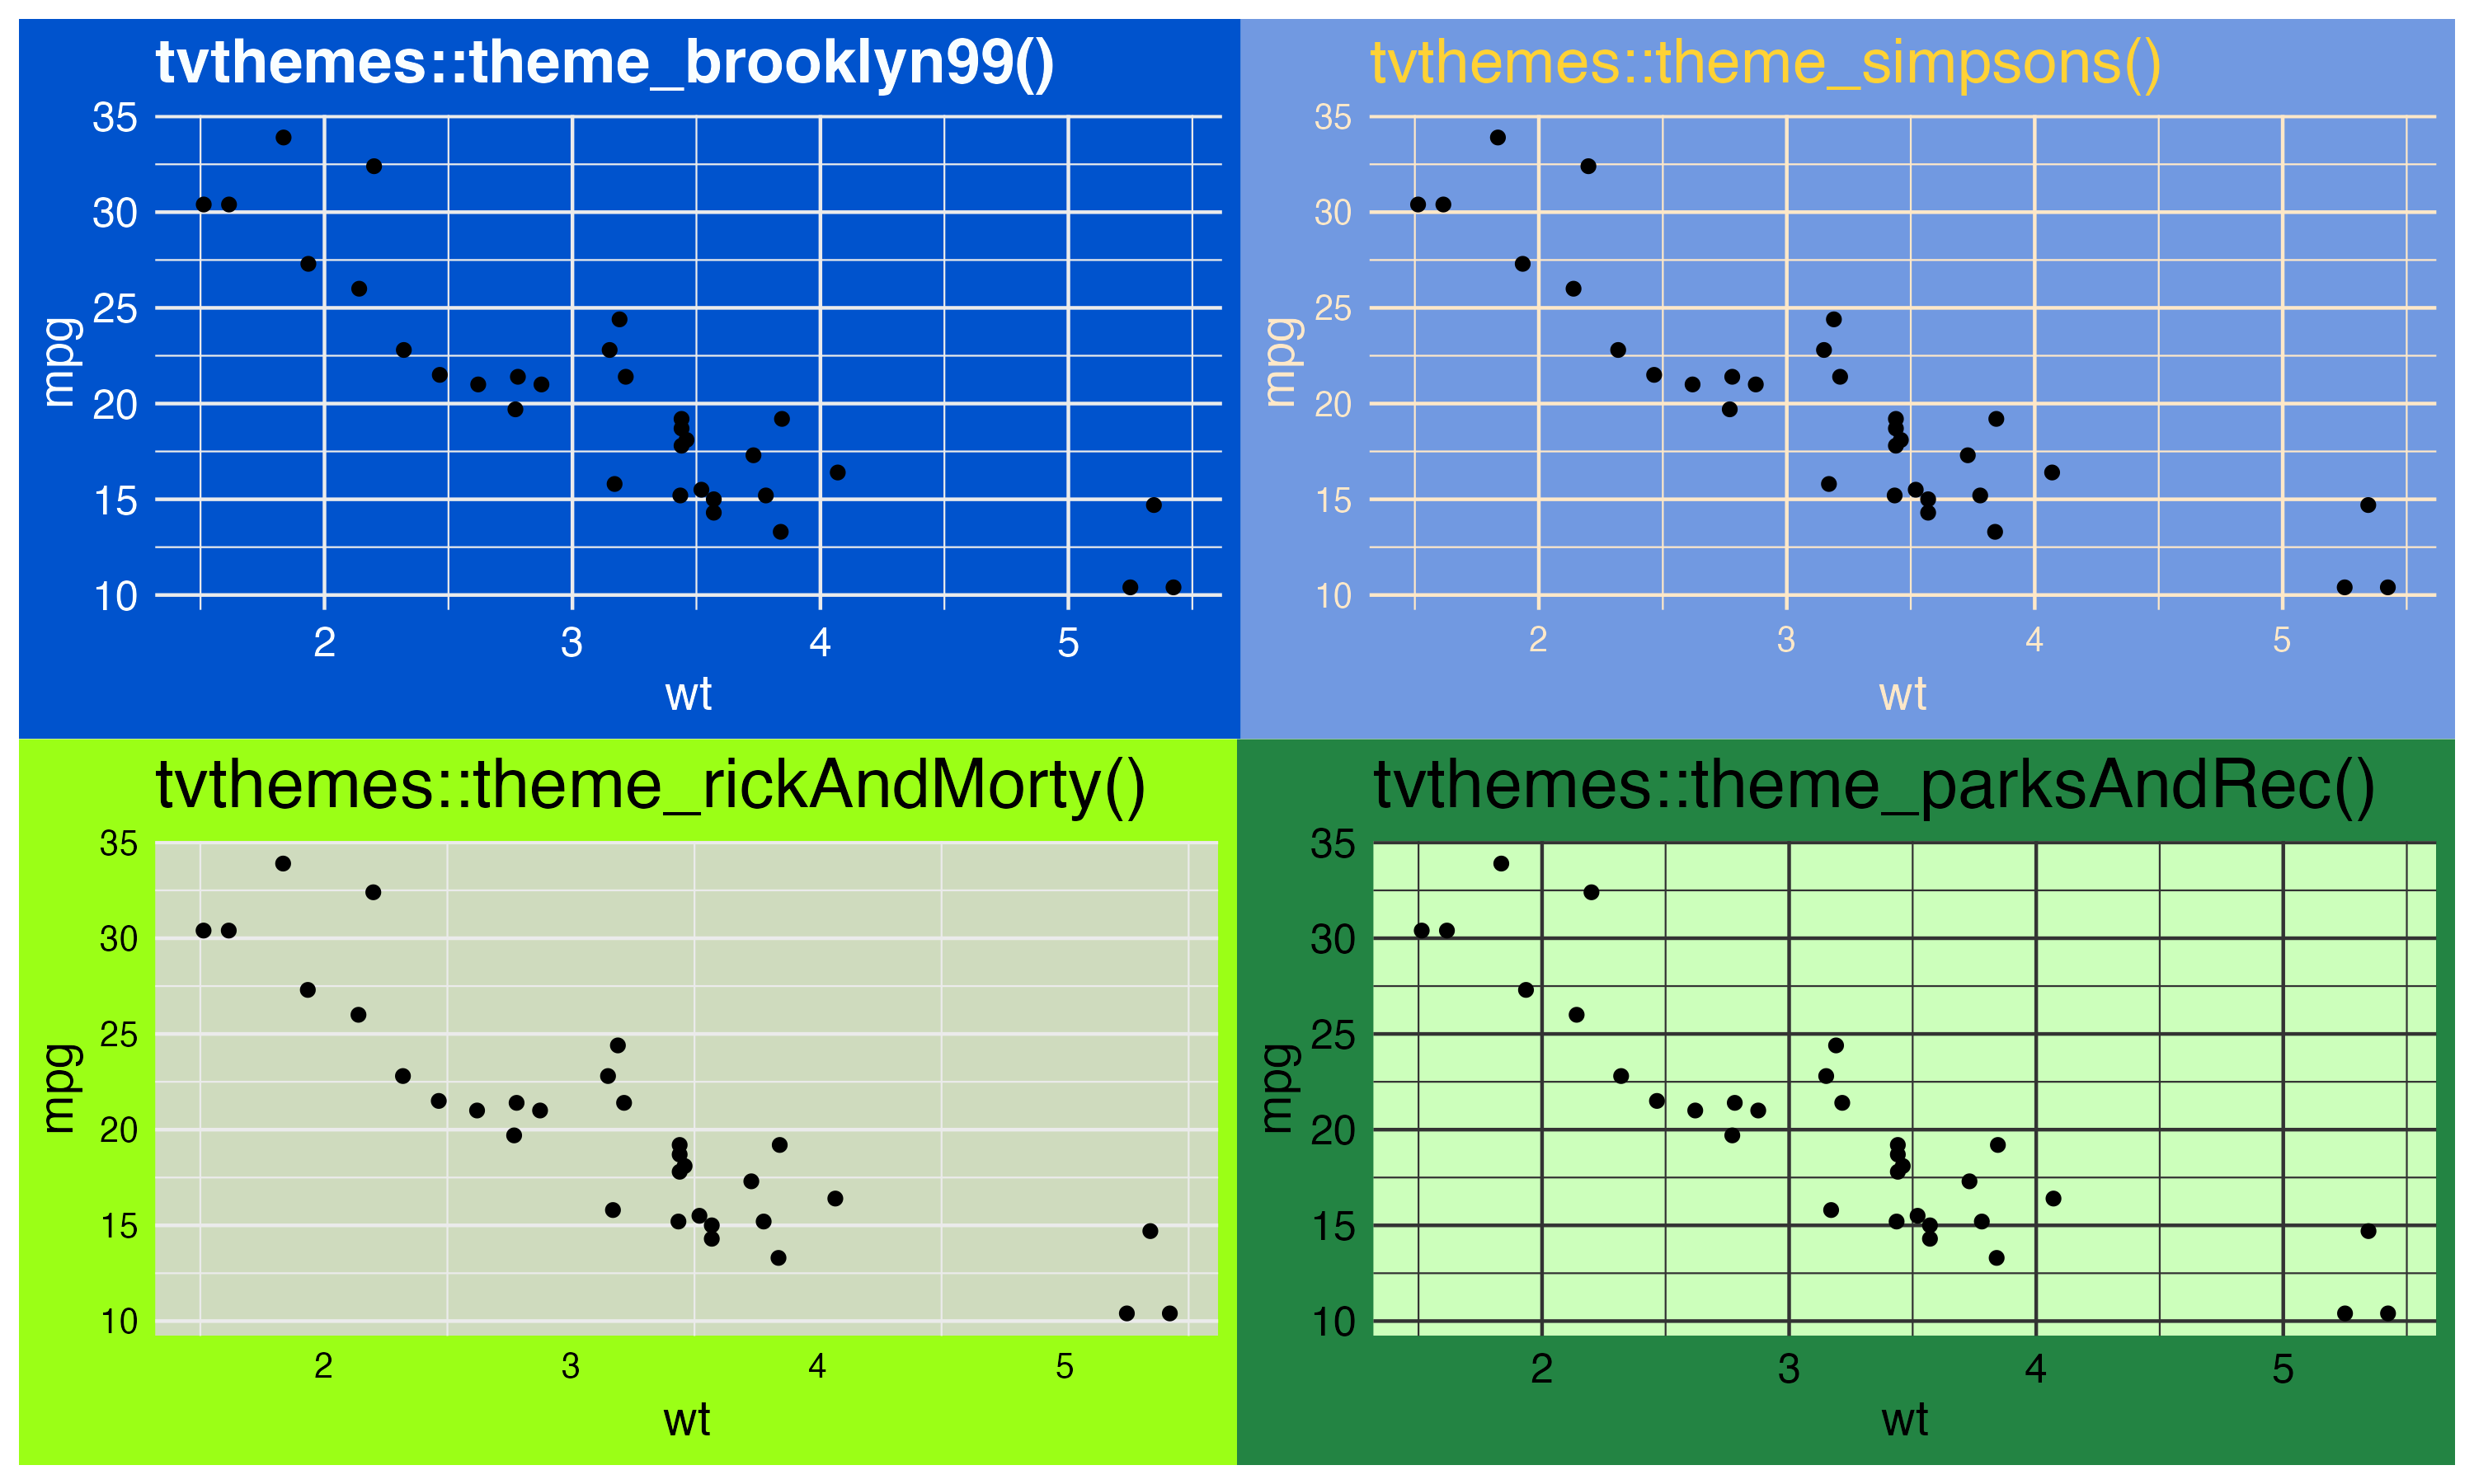
While I personally am not a great fan of these themes, I do believe they showcase how much flexibility there is in ggplot2 to customise figures. A customised ggplot2 theme is not only about changing a few grid lines but potentially about shaping the whole identity of a figure. That being said, it also shows how much work is often required to make a good visualisation beyond what can be obtained with a theme_* function. Try, for example, to make a ggplot2 object look like an xkcd comic with the {xkcd}. It is more difficult than it looks.
For another R package that introduces a lot of themes related to popular culture, do also check out the {ThemePark} package. It is not on CRAN yet so I have not included it here. However, from what I can understand, it should be on the way to a CRAN near you soon.
Category 5: Media outlets
Media outlets often have their own unique visual style, and there are of course themes available to reproduce these visual styles when working with ggplot2 objects. In the figure below I show four examples of such themes, namely ggthemes::theme_economist() (for The Economist), ggthemes::theme_fivethirtyeight() (for FiveThirtyEight), ggthemes::theme_wsj() (for Wall Street Journal), and wsjplot::theme_wsj() (also for Wall Street Journal).
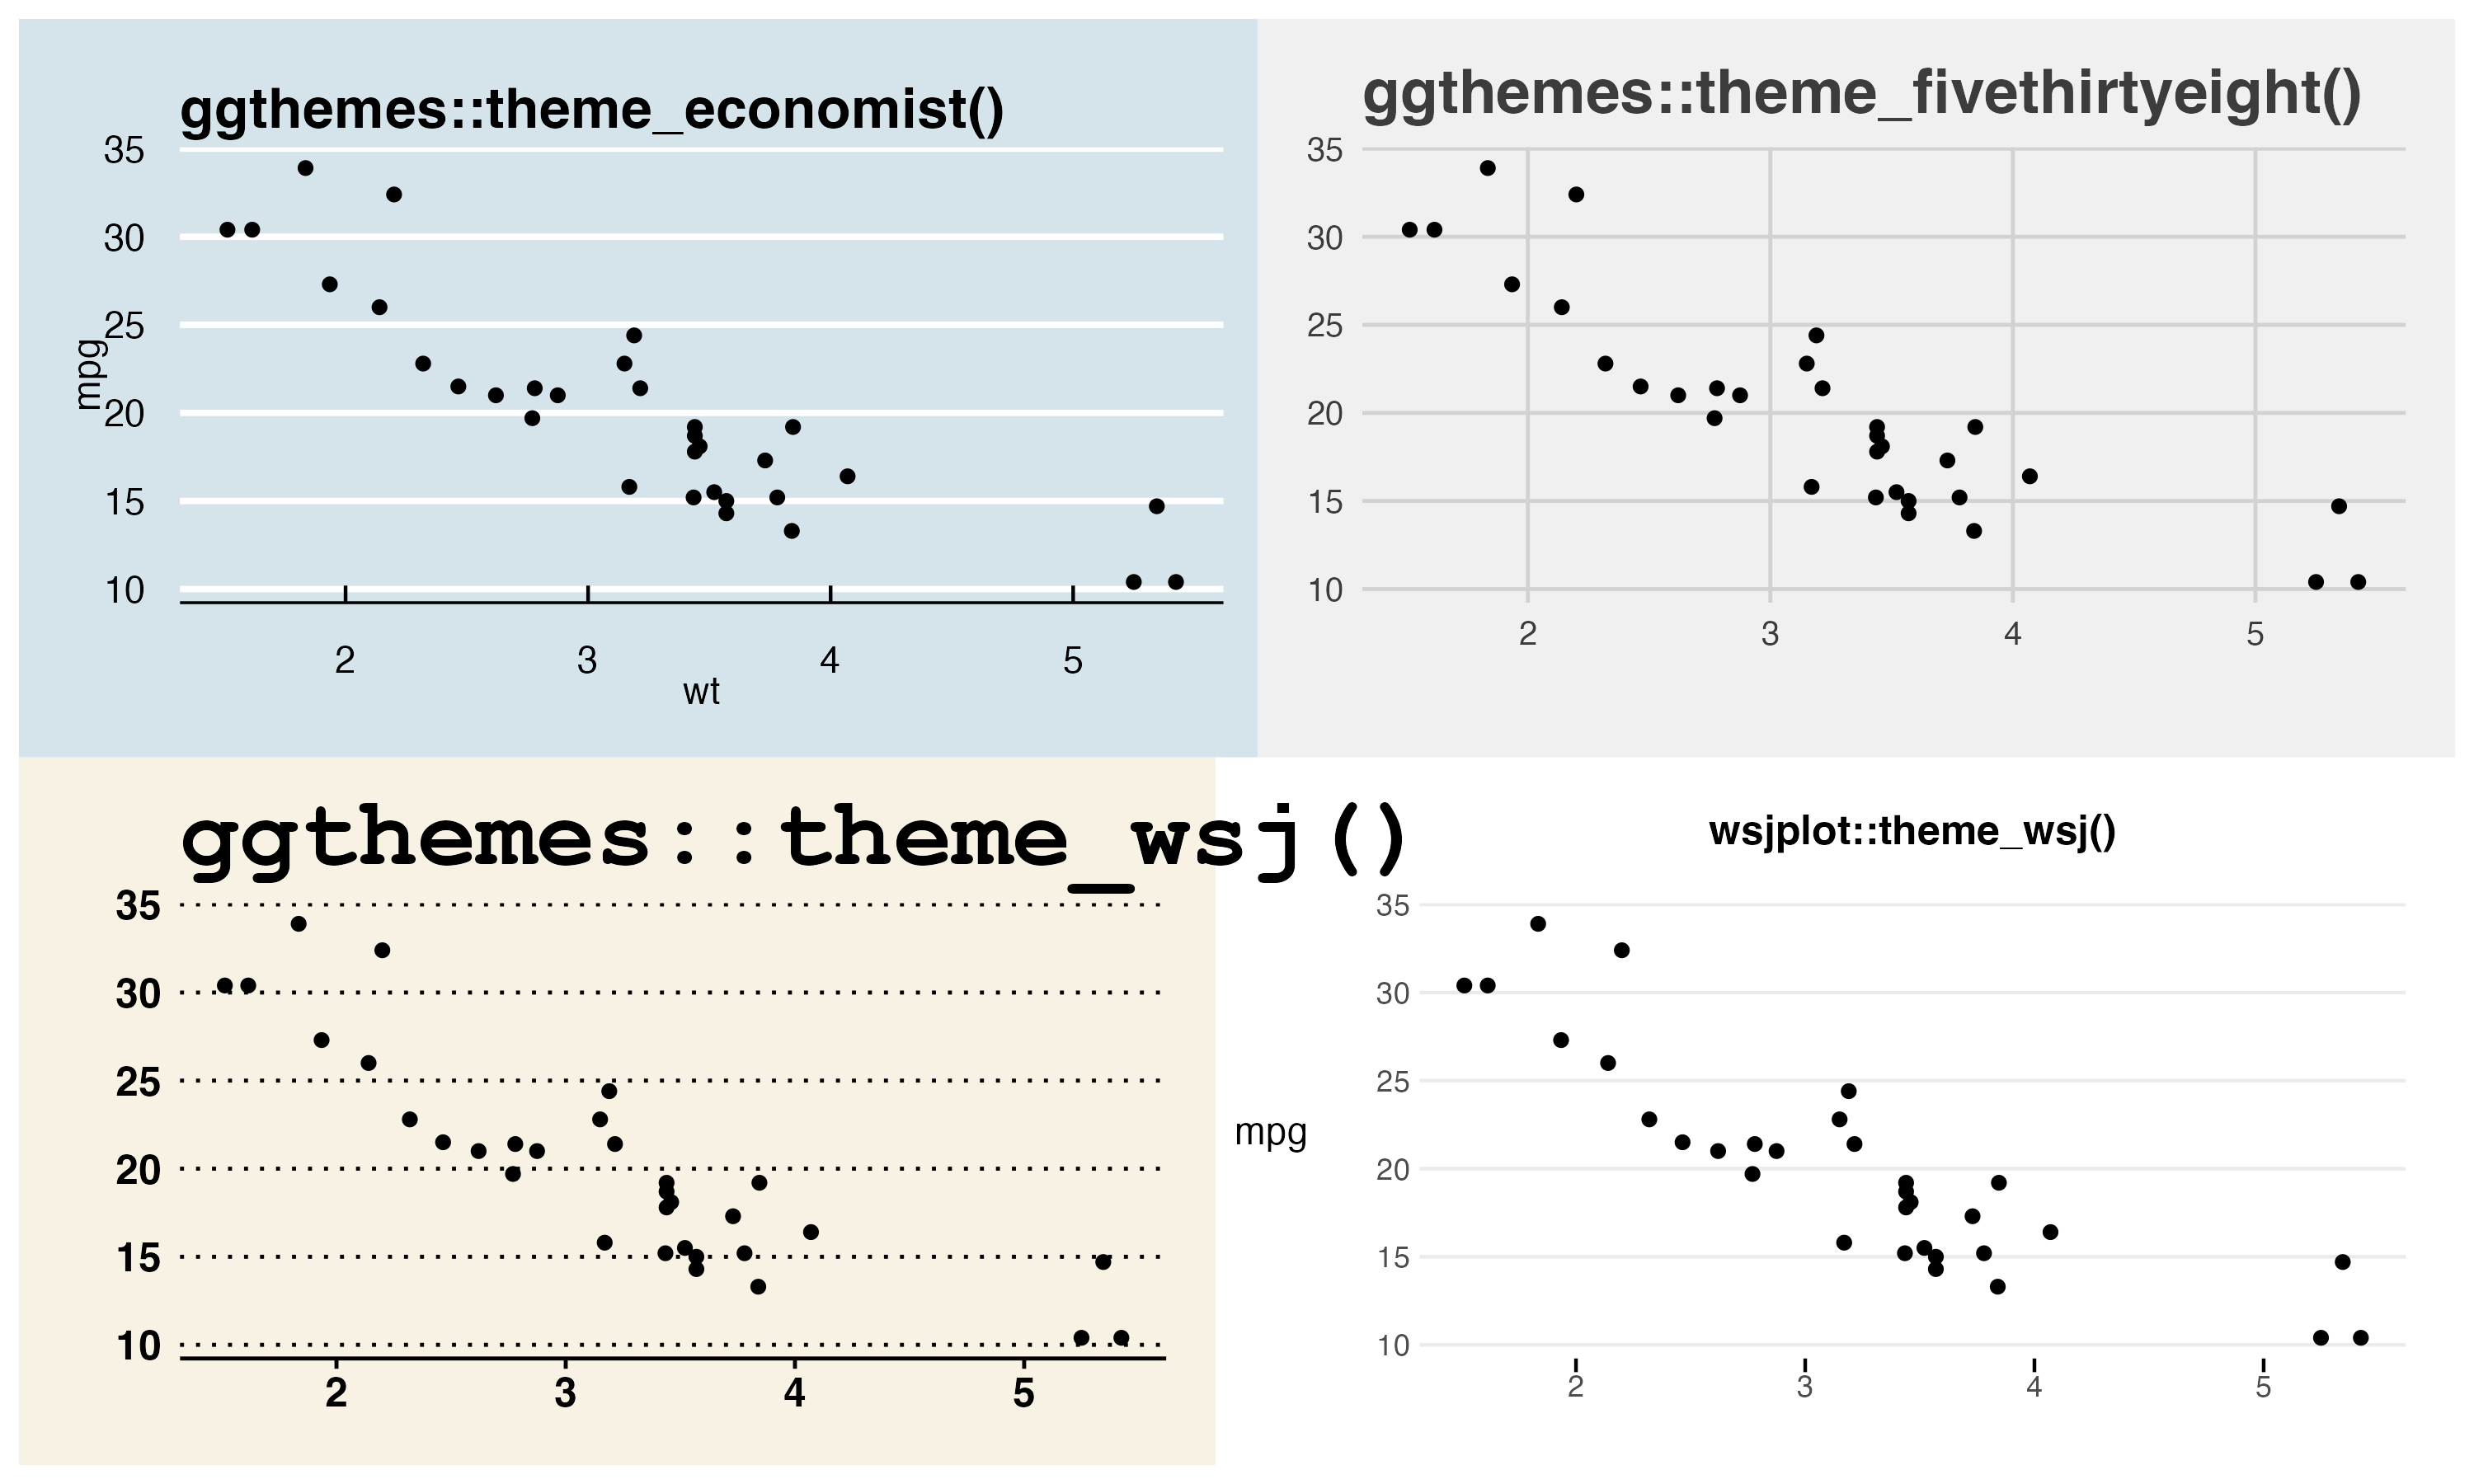
There is no guarantee that using these themes will reflect the (current) theme defaults used by the respective media outlets. For example, The Economist recently changed their style and it is not reflected in the theme above. In addition, consider how the two examples of theme_wsj() from different packages are very different.
In addition, do keep in mind that none of these themes are ‘official’ in the sense that they are associated with any of the specific media outlets. The only exception I am familiar with is the {bbplot} package (for BBC), but this package never made its way to CRAN (and I doubt it ever will).
Category 6: Software
If you do not want it to look like your figure was made with R, but instead, say, Stata, look no further. In the figure below you will find some examples of themes that reflect the theme defaults from other software, i.e., ggthemes::theme_excel_new(), ggthemes::theme_stata(), jmvcore::theme_spss(), and ggnuplot::theme_gnuplot().
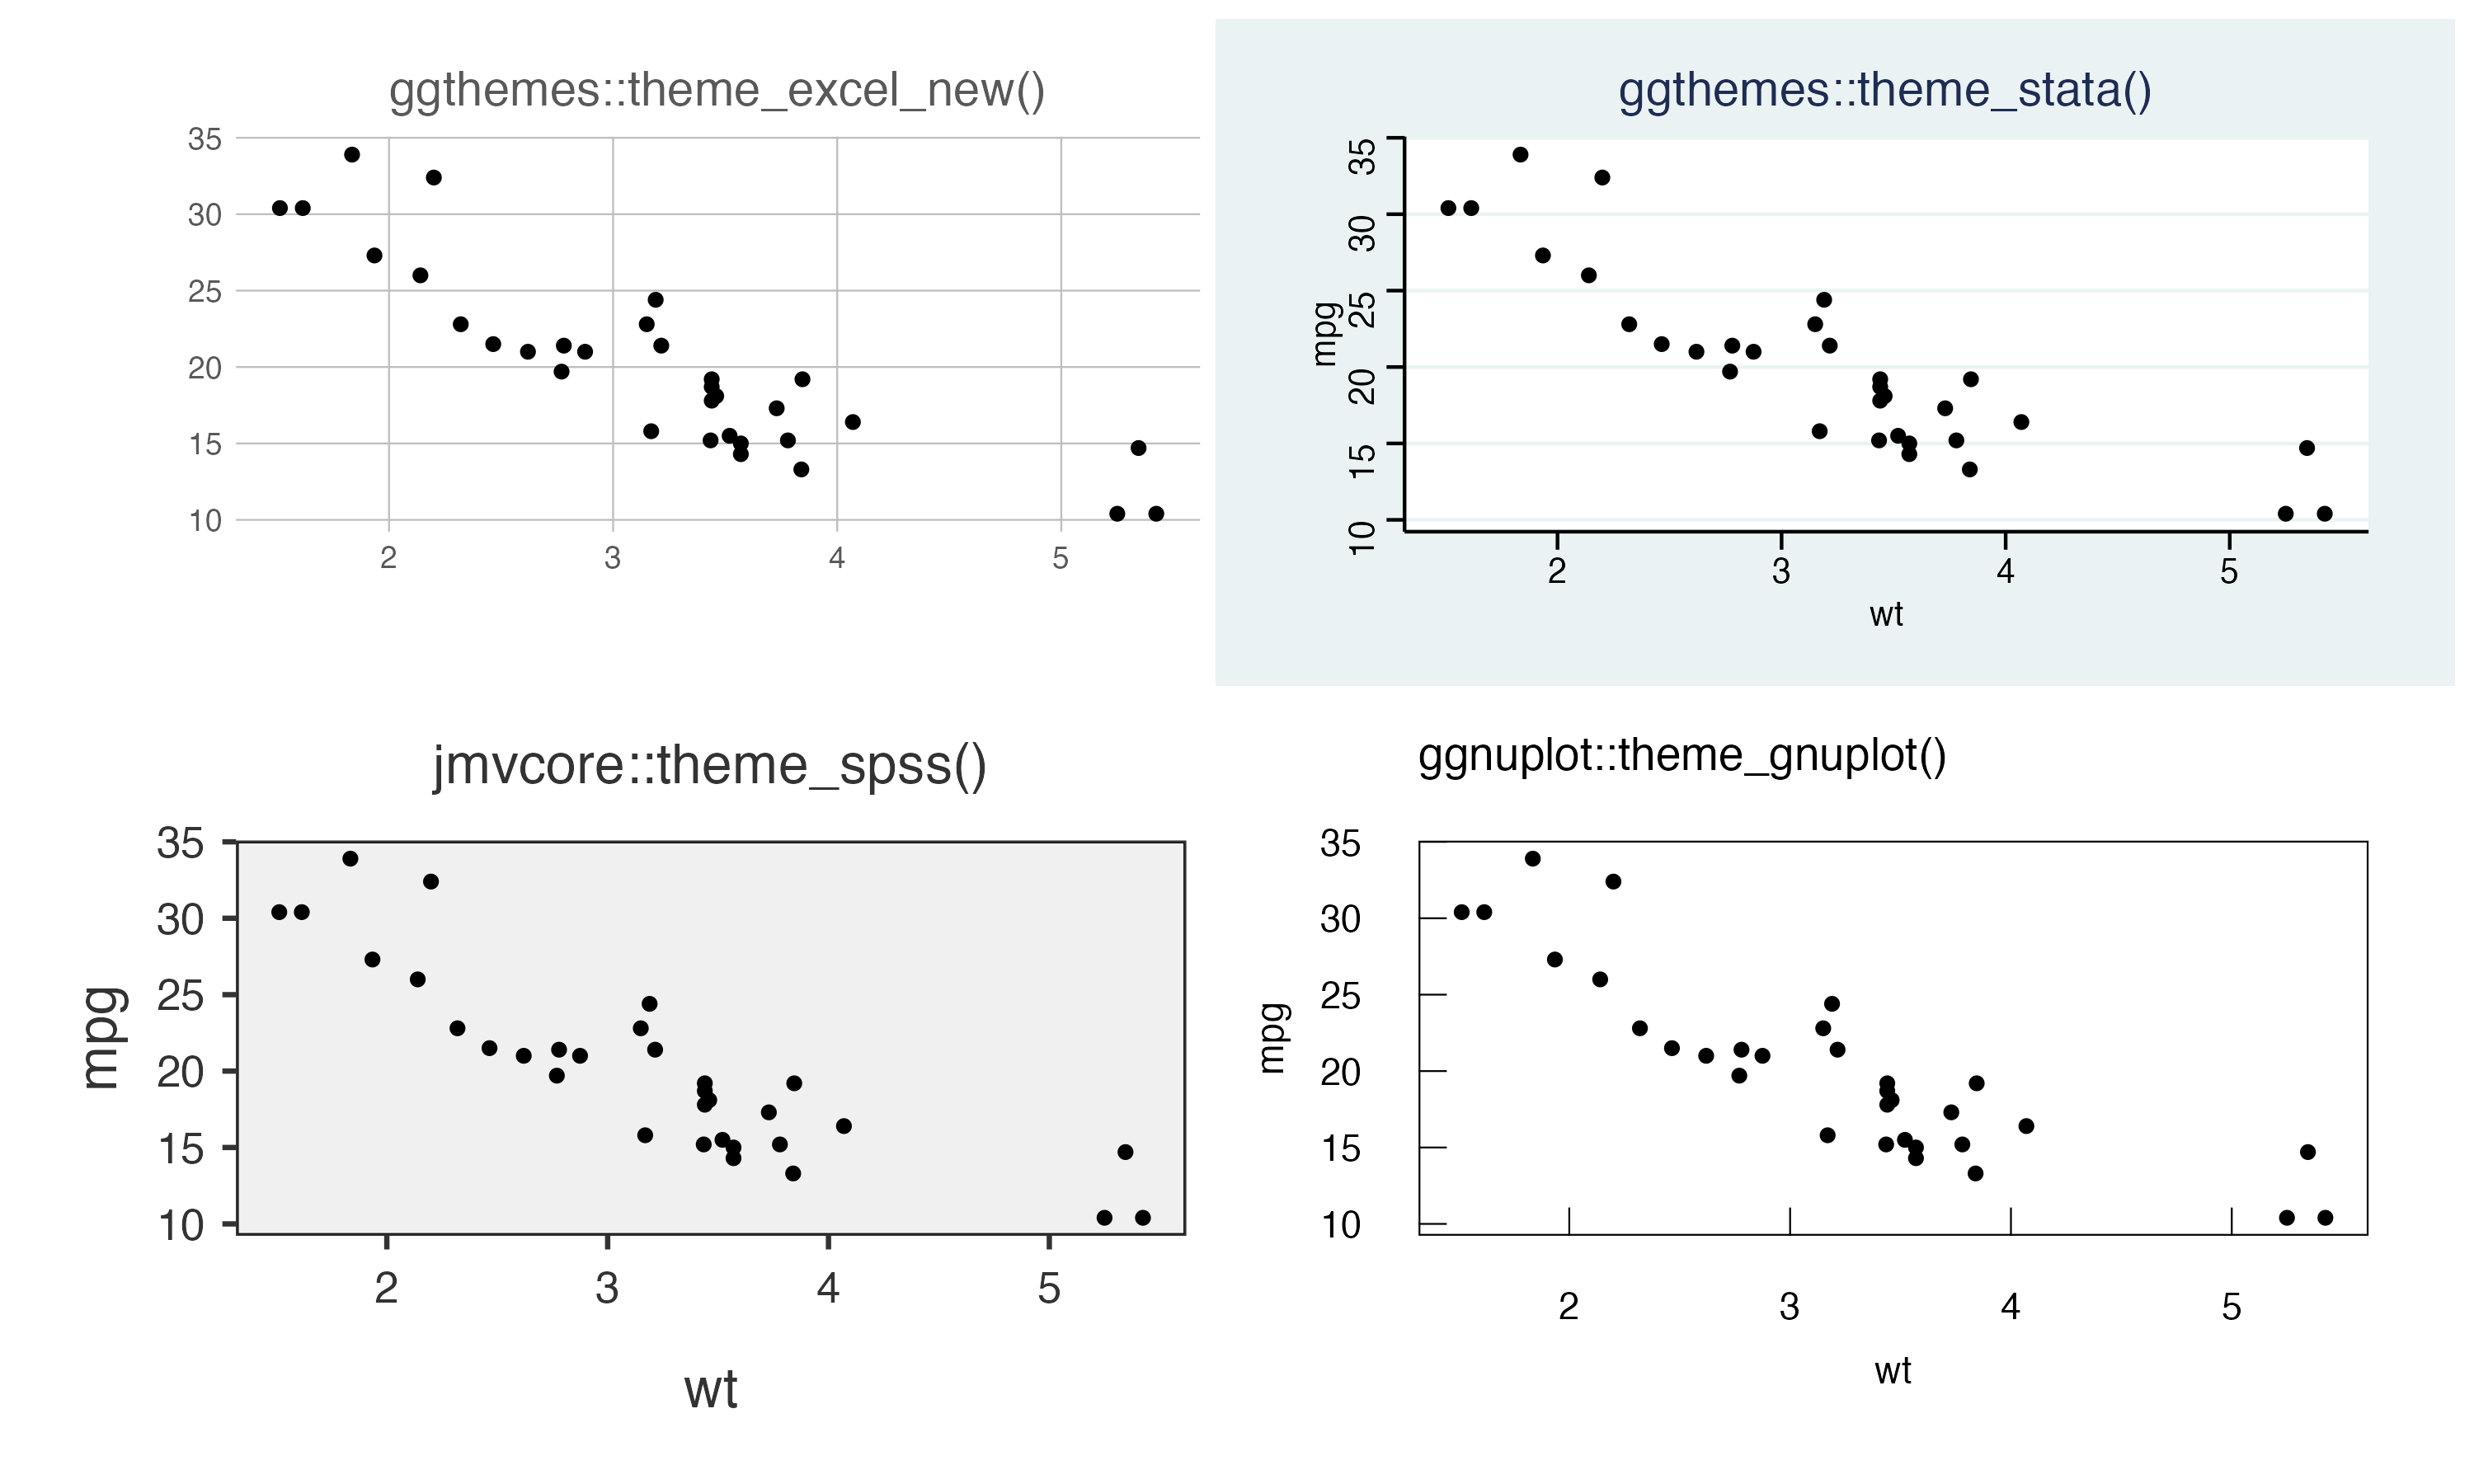
Some of these themes look good, but it is never clear to me why you would want your figures to look more like Excel than R. If anything, Excel should make it easier to make it look like your figure was made in R.
Noteworthy, the theme defaults were changed in Stata 18, so the above-mentioned Stata theme is for the now old Stata defaults. Unironically, I do like the new Stata defaults better than ggplot2 defaults. That being said, in general, I am not in favour of making it look like a figure was made in a different software.
Category 7: Statistical models
Several themes are related to the visualisation of specific statistical models. When an R package provides functions to work with specific statistical models, they often provide additional functions to help visualise the output from these models. This is similar to the packages mentioned above working with geospatial data providing theme functions removing grid lines and labels.
To better understand the usefulness of these functions, it makes sense to check out the functions in their natural habitat, i.e., when being used to visualise the output they are made to visualise. Below I show examples of such functions in the form of ggsurvfit::theme_ggsurvfit_default(), ggsurvfit::theme_ggsurvfit_KMunicate(), survminer::theme_survminer(), and ggdist::theme_tidybayes().
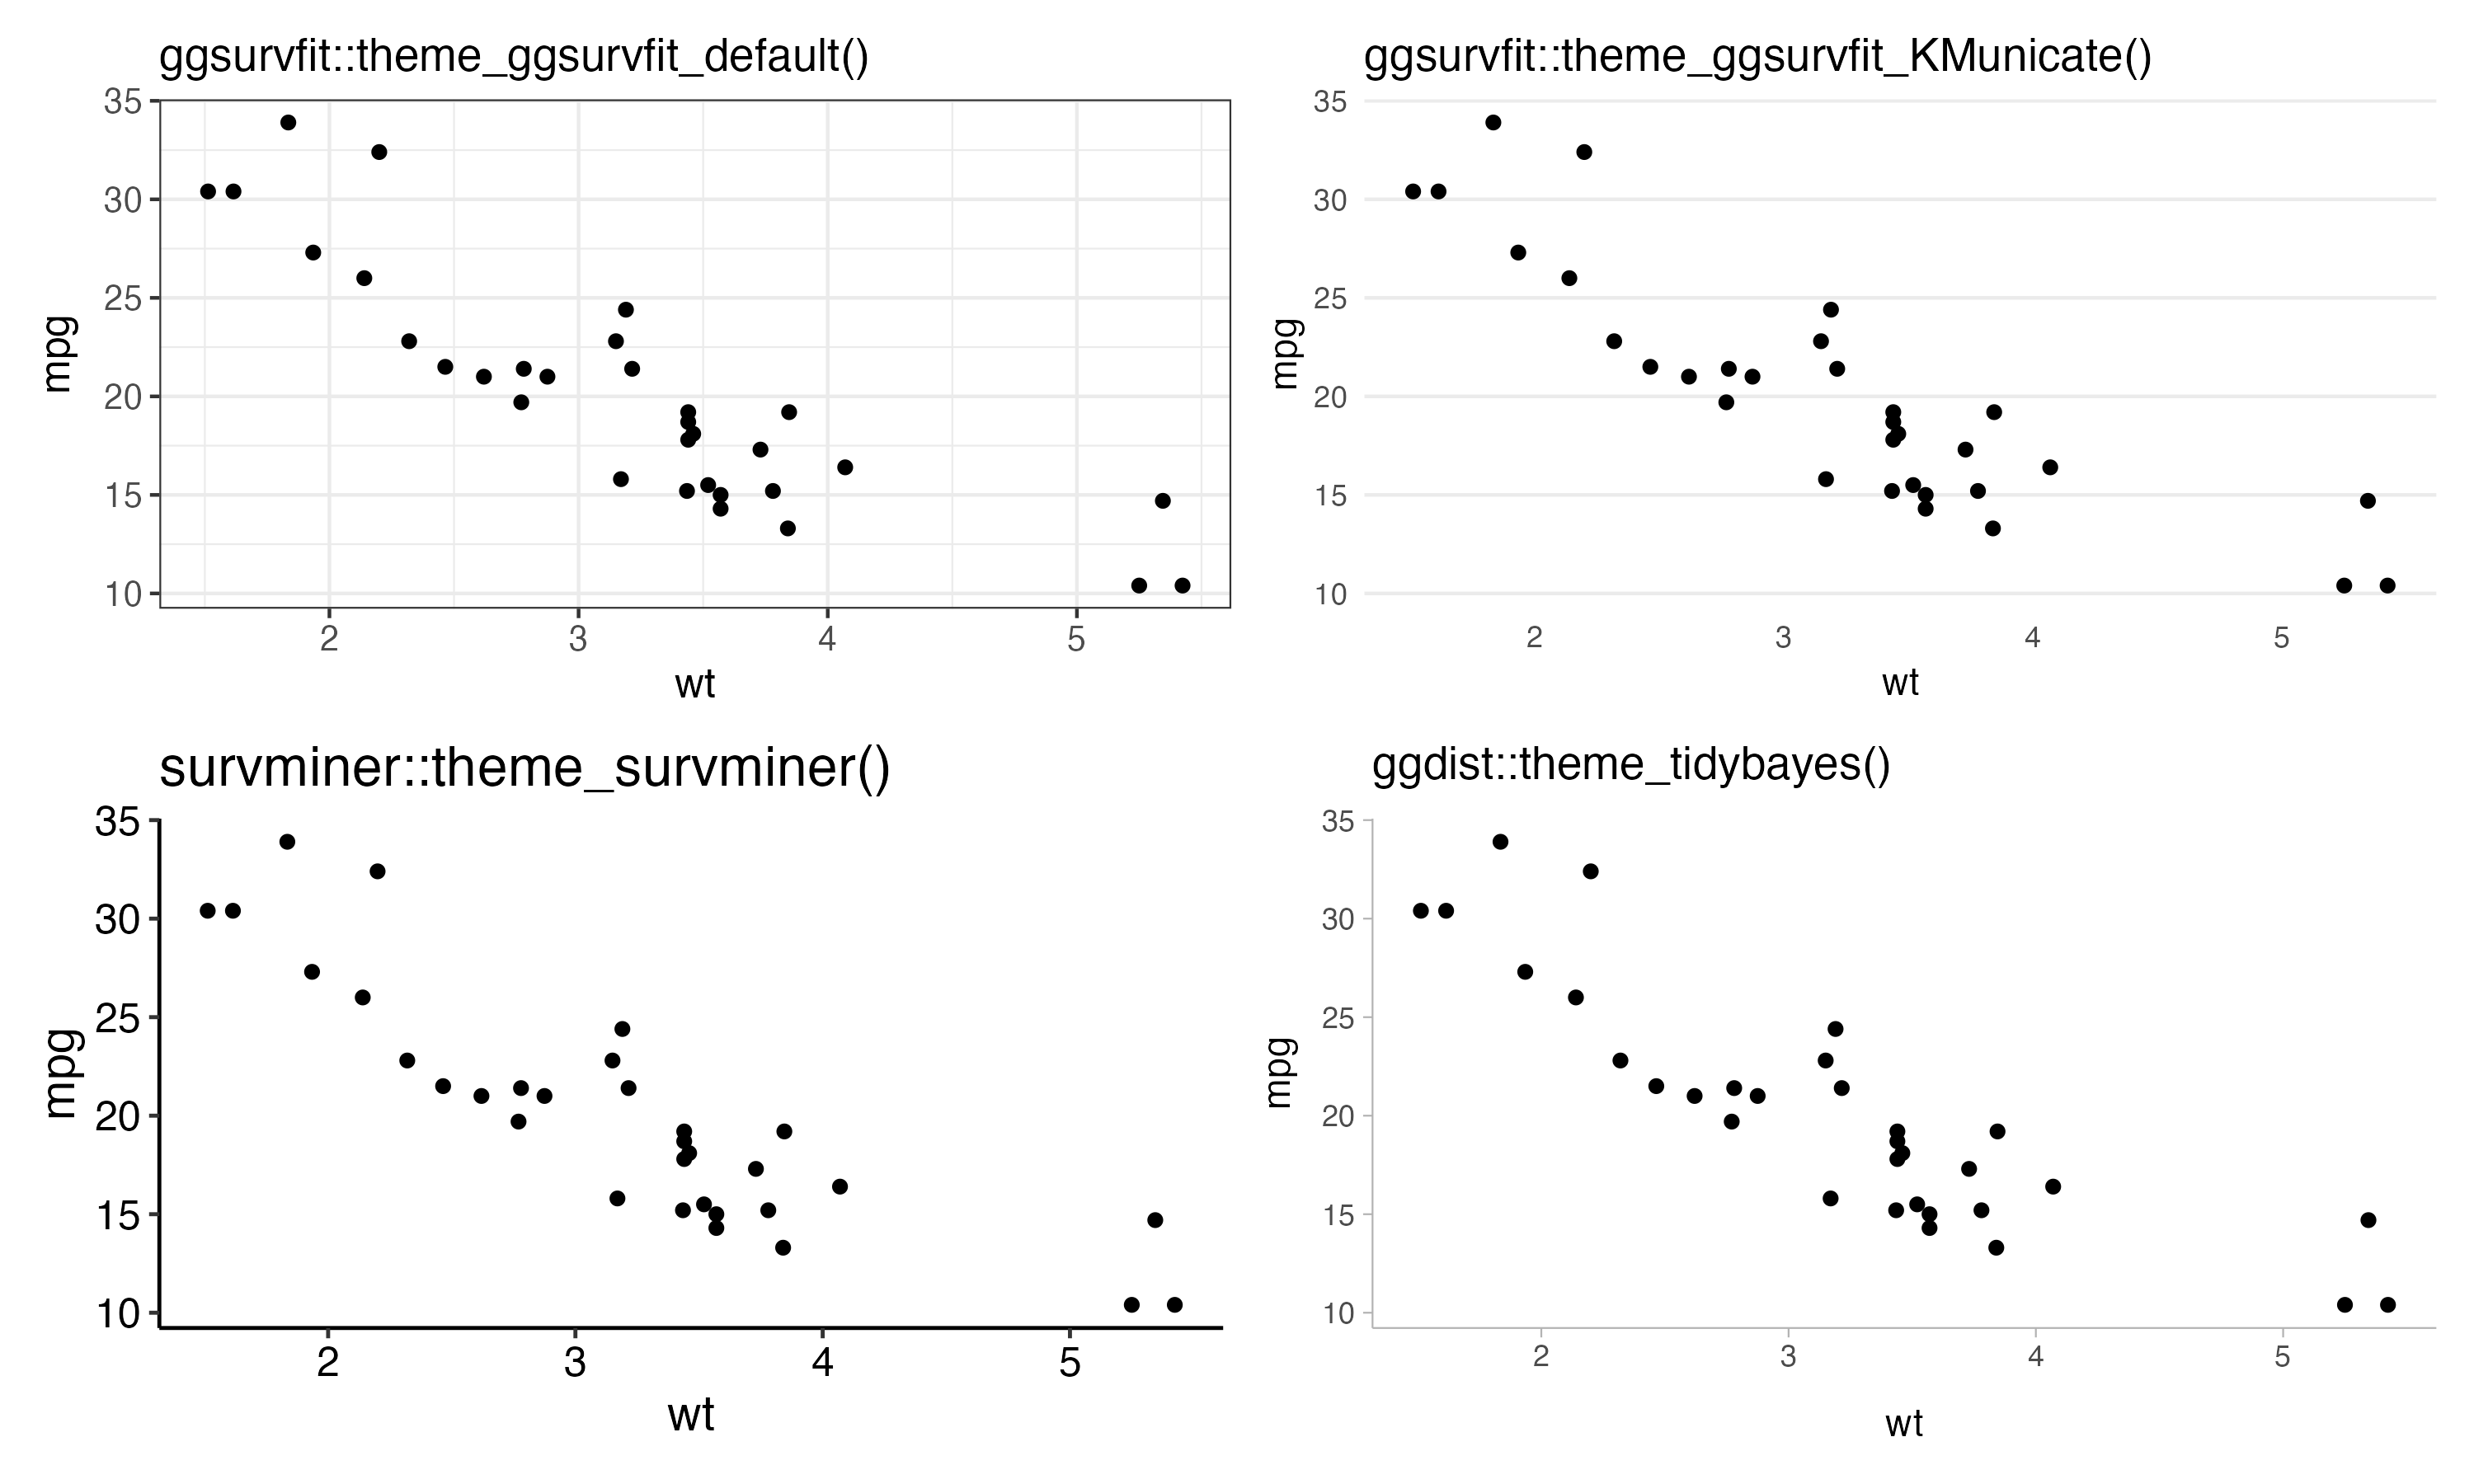
Interestingly, these themes are more than fine for most plot types. If you are looking for inspiration on how best to visualise the results from specific models, it is worth checking out the various themes available within the ggplot2-verse.
Category 8: Border, axis lines, and grid preferences
This is the catch-all category for all the themes that changes the borders, axes, grid lines, etc., but cannot fit into any of the categories mentioned so far. To just illustrate a few, here are four examples in the form of cowplot::theme_minimal_hgrid(), ezplot::theme_ez(), tinythemes::theme_ipsum_rc(), and ggfun::theme_noxaxis().
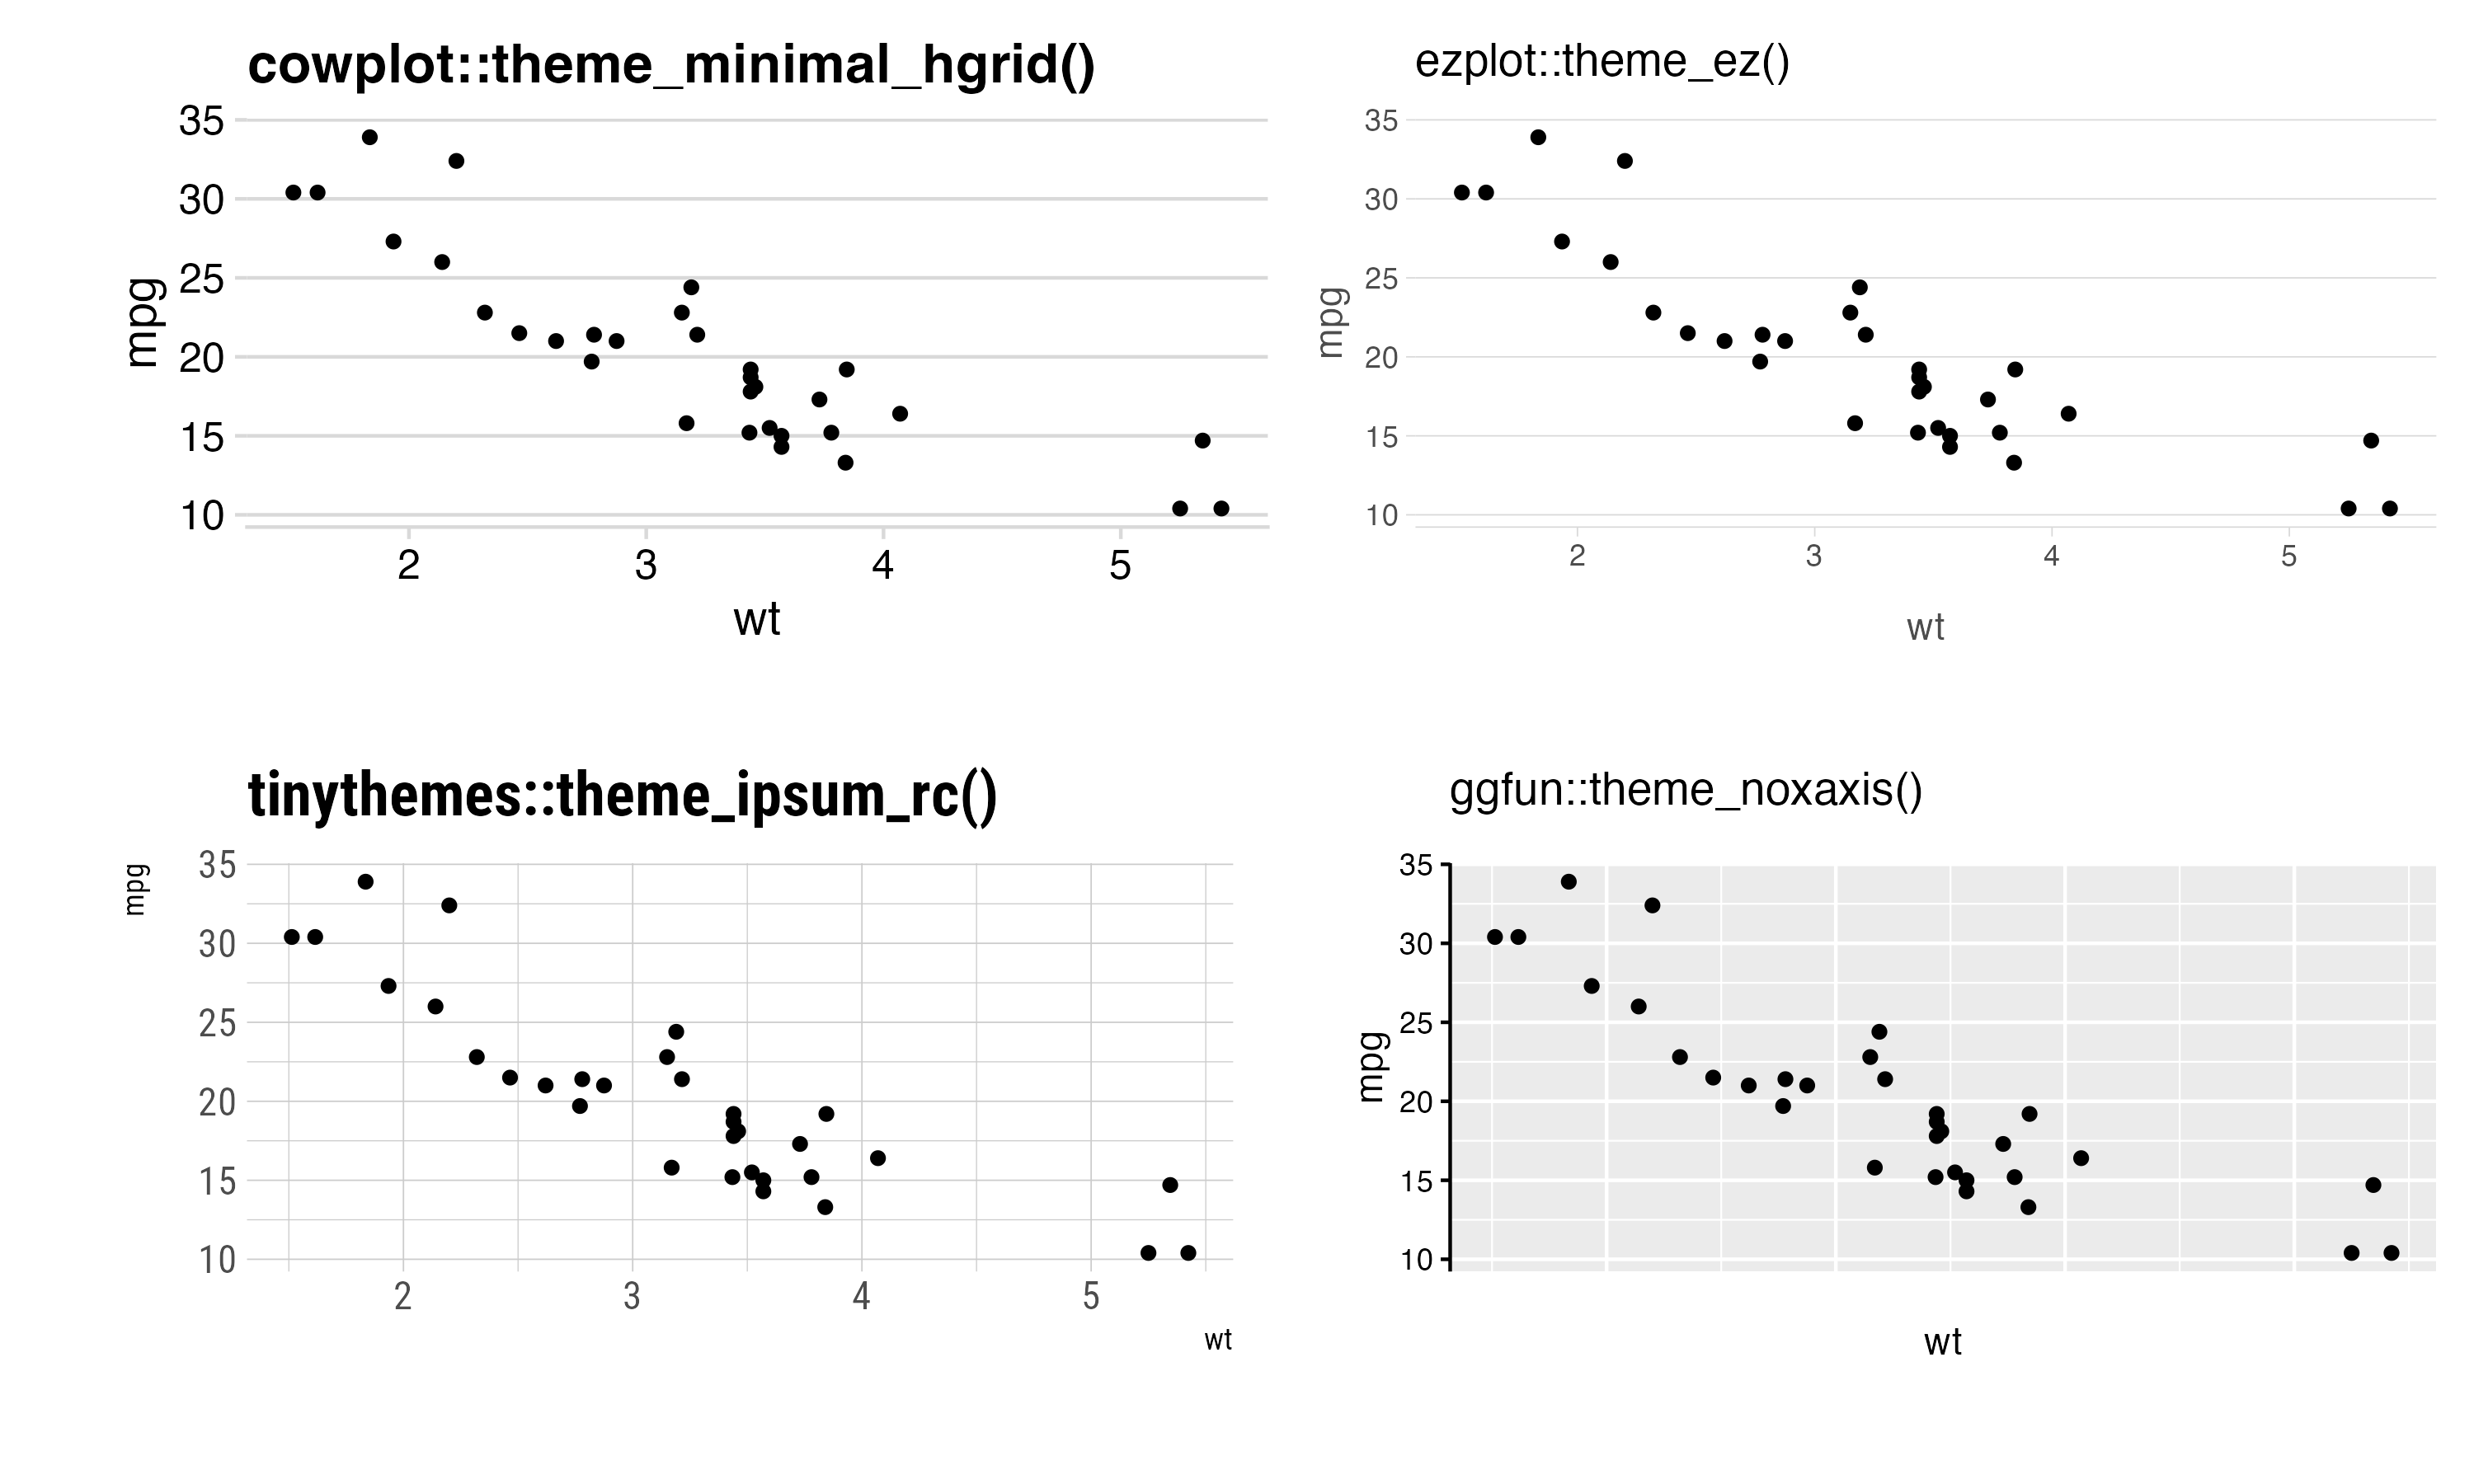
These are all – conditional upon the focus of the visualisation – great themes, and I prefer most of these themes over the default ggplot2 theme. That being said, after having gone through a lot of themes, I will still stick to the good old theme_minimal() and theme_bw().
The overview I have presented here should not be seen as a fully comprehensive overview of all themes (especially as a lot of themes are not available on CRAN), but it hopefully serves as an introduction to some of the key differences between the different themes.
Overview of packages
If there is one thing we are not running short of today, it is customised themes for ggplot2 available in various CRAN packages. In the table below, I provide an overview of all the ggplot2 themes using the theme_* syntax I have been able to locate on CRAN with information on the packages they are in and the most recent version of the package (I have sorted the packages by how popular they are – with {ggplot2} itself being the most popular).
| Package | Version | Theme functions |
|---|---|---|
As a note of caution, some of these packages have not been updated for years, and since we see updates to the theme settings in {ggplot2}, it is always a good idea to look into whether the theme you set out to use is actively maintained (including potential dependencies).
In most cases, you should be able to make great ggplot2 figures simply by using the themes provided by ggplot2 itself. However, it is worth checking out these theme functions, and in particular how they change the ggplot2 theme in order to better understand the options you have within ggplot2::theme(). In other words, come for the various theme_* functions, stay for ggplot2::theme().
I plan to look further into the packages related to ggplot2 at some point in the future. First, by expanding the analysis of the themes, e.g., by looking further “inside” the theme functions (what and how many options they use, how much flexibility they provide, etc.). Second, by also looking into other functions beyond theme_*, such as geom_*, scale_*, and stat_*. Until then, enjoy the various customised ggplot2 themes.