How good are opinion polls to capture election results in parliamentary elections? To answer this question, I collected data on 40,139 opinion polls, covering elections in 37 countries (238,019 unique party-election observations). The data comes from a variety of sources, including European Opinion Polls as Open Data, POLITICO Poll of Polls, Wikipedia, and country-specific datasets (such as my own dataset with opinion polls in Denmark).
As my primary objective is to compare opinion polls to election results, I only used results from opinion polls that I could link to elections and parties covered in the ParlGov database (Döring et al. 2022). The database is ideal as it covers all parliamentary elections since 1945 with information on both vote share and seats obtained by different parties. In addition, there is information on the party family of the parties, making it possible to assess whether polling errors correlate with political variables. Most importantly, the ParlGov database is updated annually, making it possible for me to easily identify and update the dataset on opinion polls in the future (i.e., when there is a new release of ParlGov).
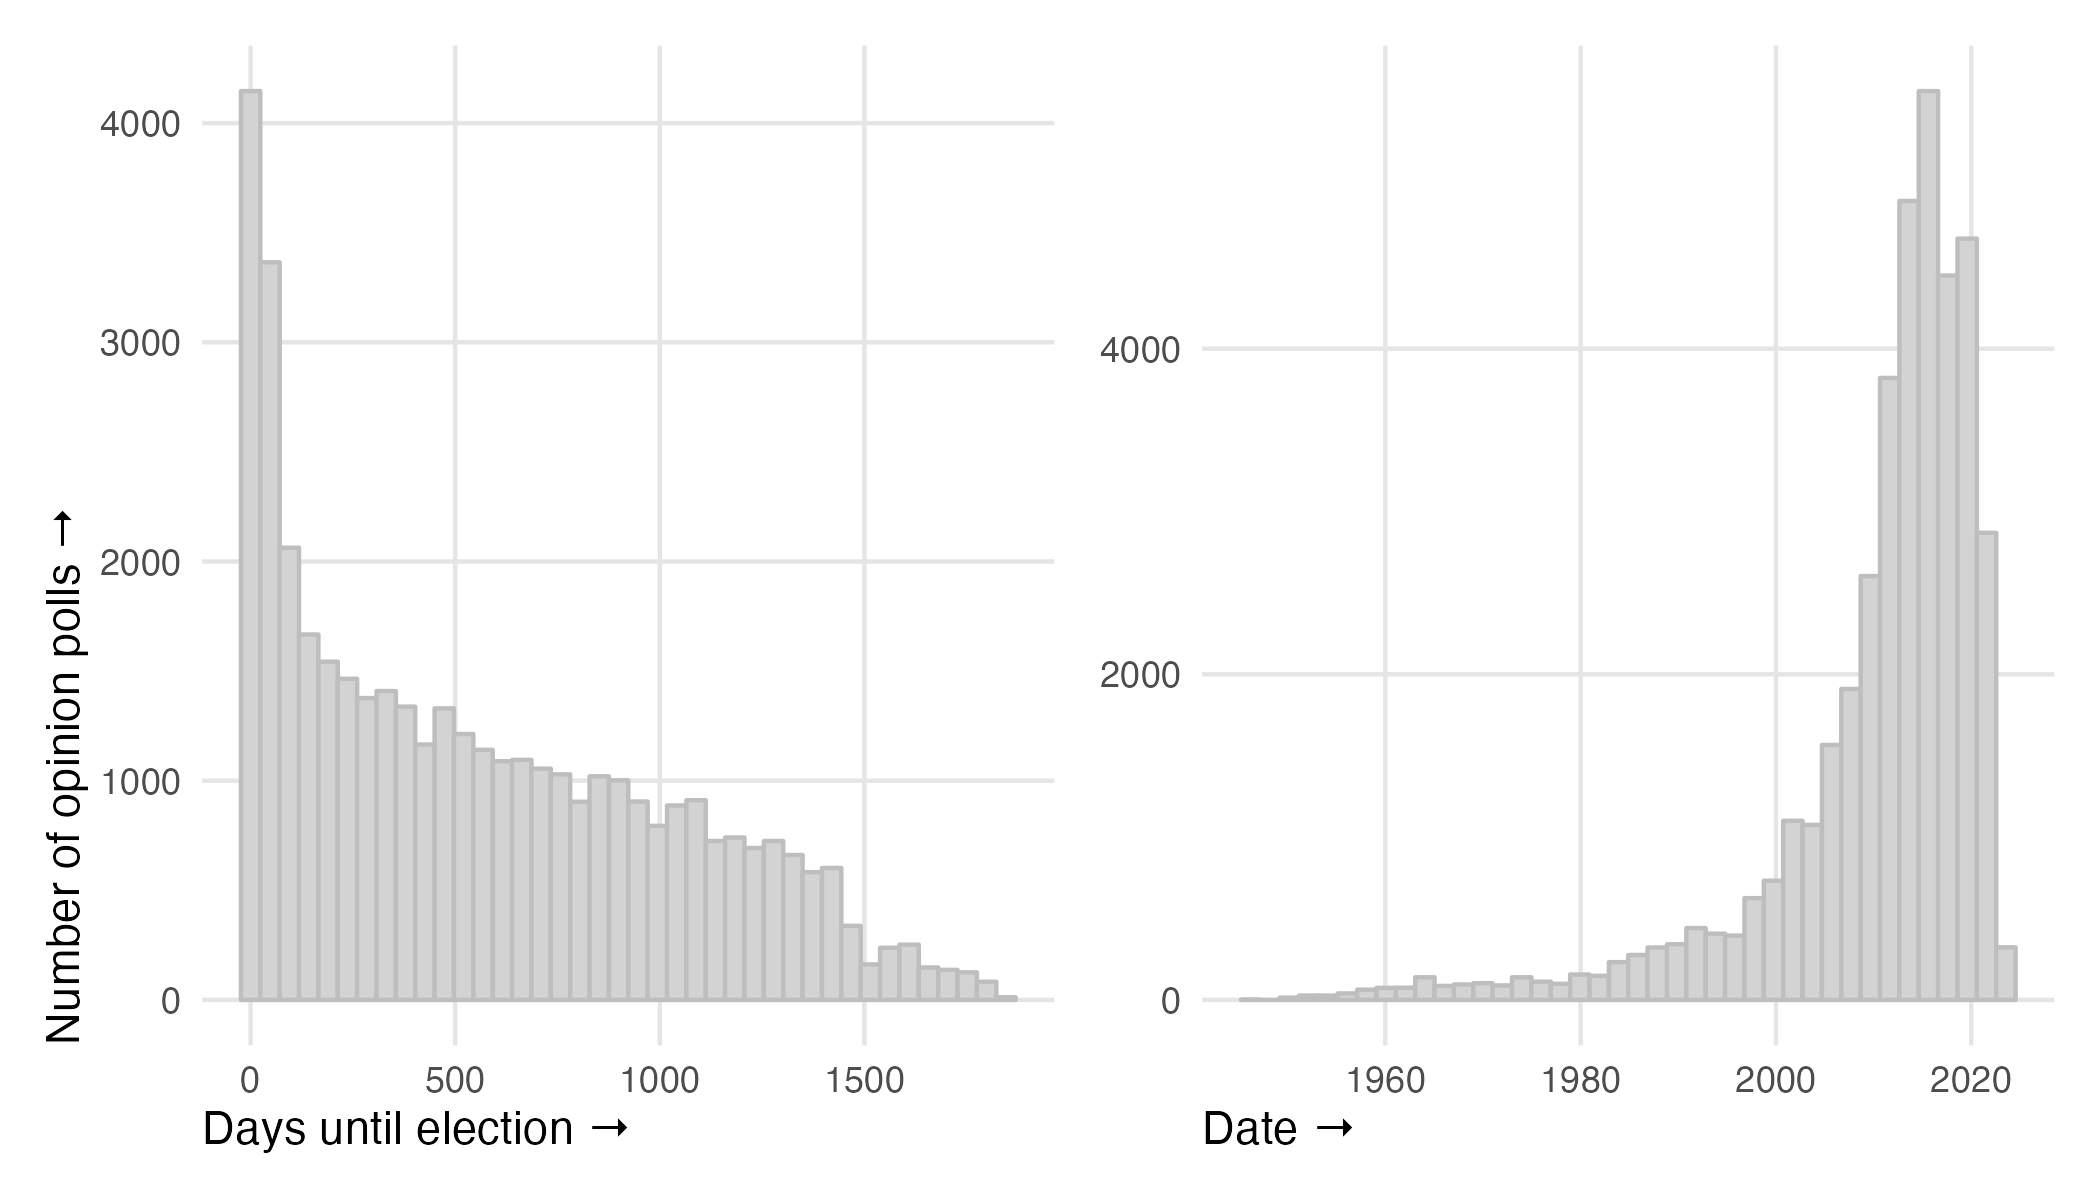
Alas, it is currently not possible to cover all elections with data on opinion polls. The poll coverage is better for more recent elections and for countries such as the United Kingdom, Canada, and Sweden, compared to countries such as Japan and Israel. Currently, the data covers 40% of all elections since 1945 (more than 75% of all elections since 2000). The figure below shows that, as we get closer to election day, we see more polls (left panel), and that we have more polls from 2000 onwards (right panel).
Previous work has aimed to understand the magnitude and sources of polling errors in different countries, such as Australia (Goot 2021), Canada (Coletto and Breguet 2015), France (Durand et al. 2004), Hungary (Bodor 2012), Italy (Callegaro and Gasperoni 2008), Mexico (Cantú et al. 2016), the Netherlands (van der Meer et al. 2023), New Zealand (Wright et al. 2014), Portugal (Magalhães 2005), the United Kingdom (Prosser and Mellon 2018), and the United States (Kennedy et al. 2018). Similarly, there has been some comparative work, including polling errors in European Parliament elections (Giuliani 2019). Jennings and Wlezien (2016, 2018) provide a comparative analysis of polling errors (with a poll of polls), including both parliamentary and presidential elections. Last, Puleston (2017) looked at 31,310 polls from 473 elections and found that the average error of polls was 2.5 (for the polls conducted within seven days before an election).
When we look at the correlation between the results in opinion polls and the election results in the few days before the election, we find a very strong correlation (r ≈ .99). In other words, on average, opinion polls are extremely good at predicting the election results. To my knowledge, there is simply no better method to capture public opinion, and in particular vote intentions in parliamentary elections, than opinion polling (I wrote a post last year with a similar point).
In the figure below, I show the correlation between opinion polls and election results for different weeks. For example, the first point to the left is the correlation in the final week prior to election day. The results are not too surprising here and very much in line with the previous work cited above. The closer we get to election day, the stronger the correlation between opinion polls and the election results. However, even a year prior to election day, opinion polls show – on average – a strong correlation with parliamentary election results.
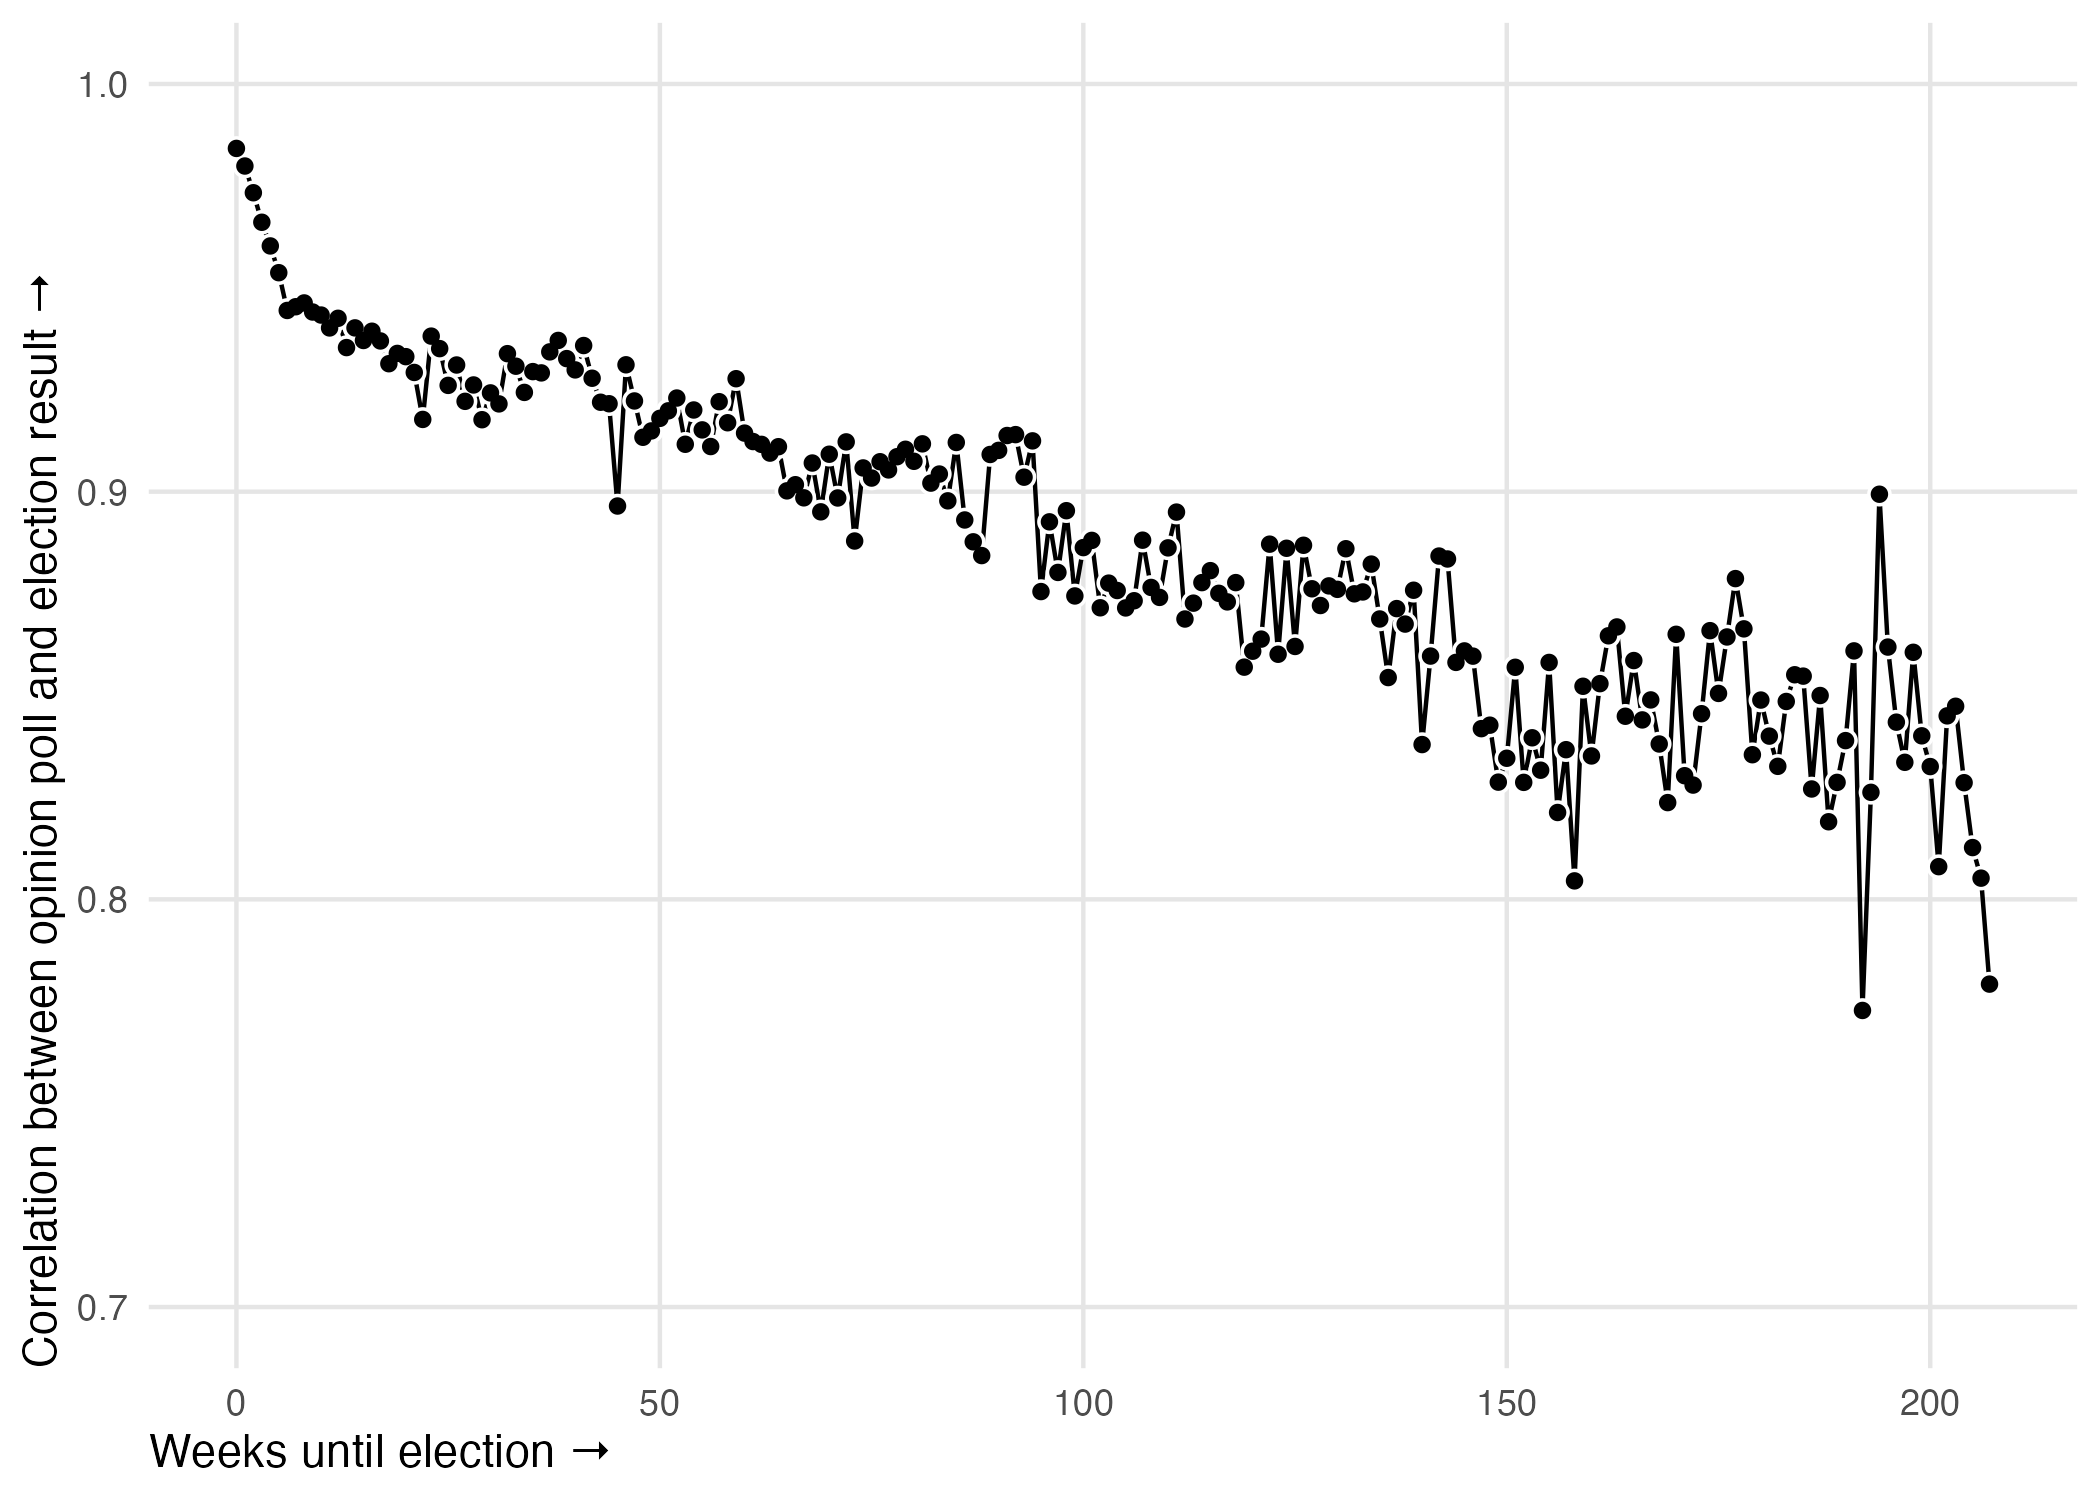
These findings are consistent with the fact that a significant proportion of the electorate make up their mind in the last months before an election (cf. Pennec and Pons 2023). This can also partially explain why polls prior to election day differ from the election result. For example, a study by Callegaro and Gasperoni (2008) showed that a 15-day pre-election embargo on publishing results could partially account for the polling failure in the 2006 Italian Parliamentary Election.
Keep in mind that this is not because opinion polls get “better” as we approach election day, only that opinion polls capture public opinion at a single point in time. Opinion polls are almost perfectly correlated with election results, and the weaker correlations away from the election day should be seen as a near-perfect correlation with a ‘hypothetical’ election that did not take place that specific day. In other words, the goal of an opinion poll is not to predict public opinion on a specific day in the future, but gauge public opinion on the day or days the poll is in the field.
The power of opinion polling is important to take into account when we discuss the value of adding additional data to predict elections, such as Wikipedia pageviews (Smith and Gustafson 2017) and social media data (Tsakalidis et al. 2015). That is, it is difficult to see how additional data – with its own limitations – can be useful to improve the accuracy of contemporary polling.
However, just because there is a very strong correlation between opinion polls and election results, we do not see all polls being accurate. On the contrary, we see many opinion polls conducted in the few days before the election having an estimate with a 95% confidence interval that does not include the election result. In other words, we are much too confident in opinion polls if we only believe that one in 20 estimates will be wrong.
The figure below shows the opinion polls with information on whether the election result in inside or outside the 95% confidence interval. Polls where I do not have information on the sample size are shown with a gray colour. The dashed lines show the 95% confidence intervals of opinion polls with a median sample size (N = 1,201). Accordingly, we prefer the individual observations to have a green colour or/and be within the dashed lines.
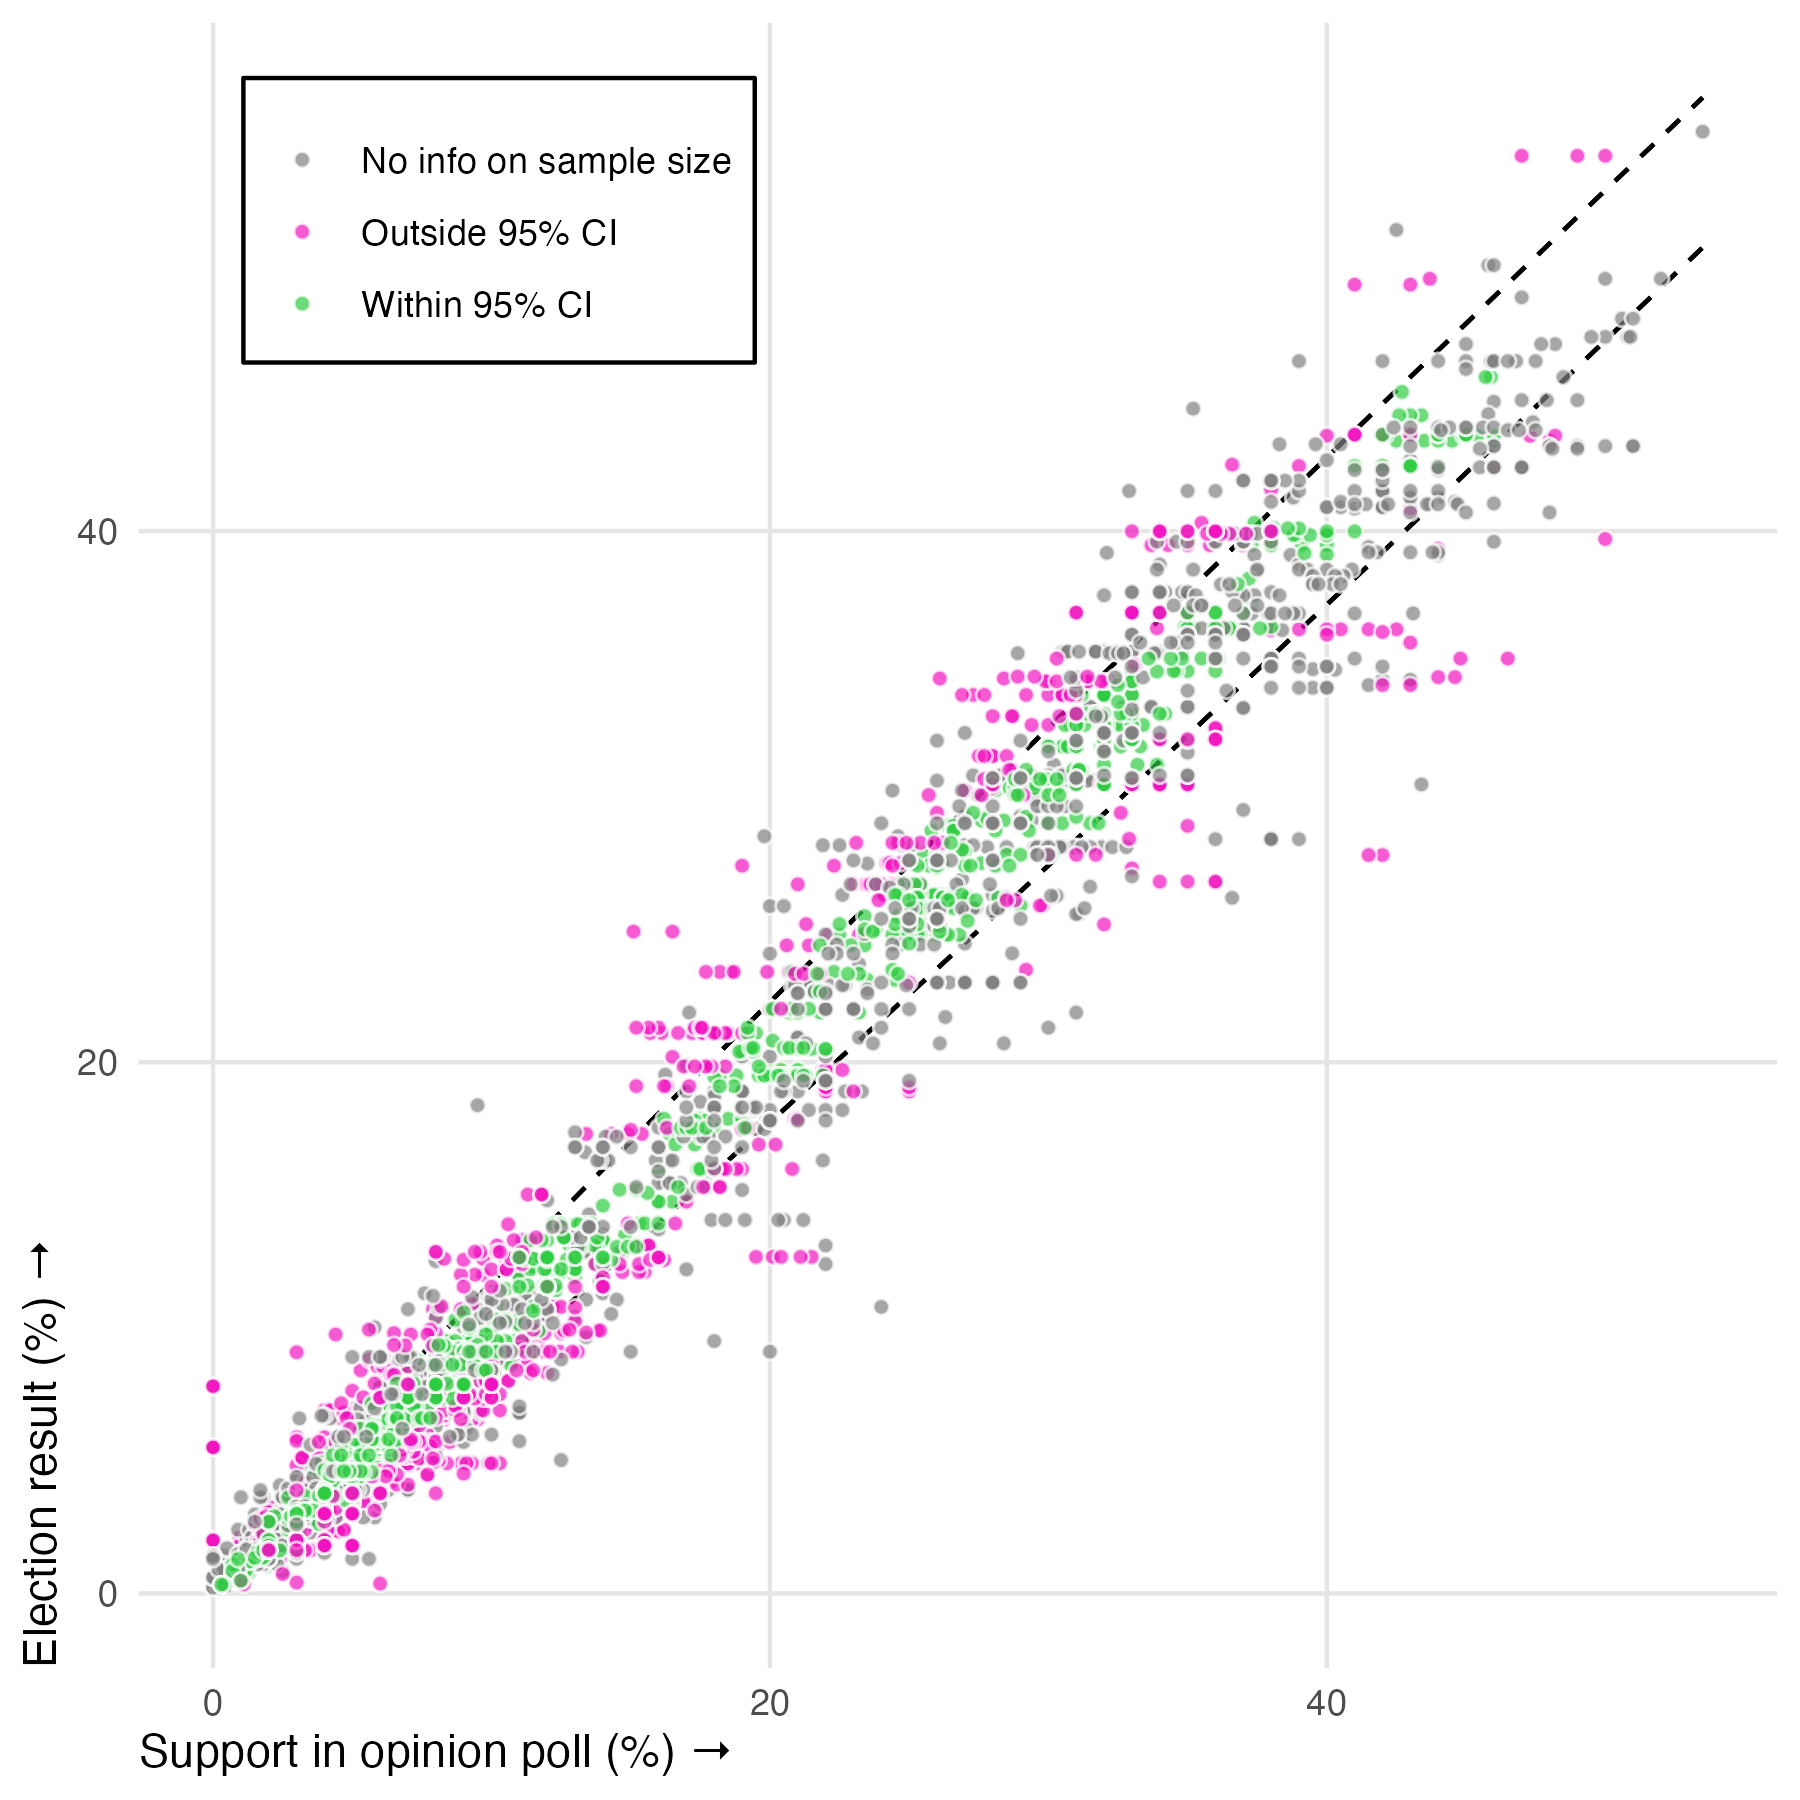
Interestingly, while a greater sample size is usually better, polls with a greater sample size are more likely to be wrong. This is not because such polls are less accurate per se, but because their estimates are more likely to be outside the 95% confidence interval (as the confidence interval is a function of the sample size). In general, I believe the focus on the sample size is overrated, and I do not believe that an opinion poll with a sample size of 1,500 is, all else equal, more likely to be correct than an opinion with a sample size of 1,000 (see this post with some of the reasons why).
There are various error metrics we can explore to get a sense of how accurate the polls are, from the mean absolute error (MAE), root mean squared error (RMSE), mean absolute percentage error (MAPE), misses outside margin of error, etc. I usually prefer to look at the RMSE, but the differences between the error metrics tend to be miniscule. Accordingly, when I have examined how polls perform using the different metrics, I have not seen significant differences.
The key lesson here is that, while opinion polls – on average – provide reliable insights on how political parties will perform in parliamentary elections, assuming that opinion polls rely on random sampling will result in too much confidence in how accurate opinion polls are. The 95% confidence interval is great as it puts emphasis on the inherent uncertainty in polling, but it is much too optimistic in how much confidence we should put in the intervals. In the future, I would like to see a lot more work on how to provide better estimates on the uncertainty we see opinion polls when we are not relying on random sampling (preferably empirically derived intervals).
Next, we can explore whether opinion polls are politically biased. In the US, Shirani-Mehr et al. (2018) show that opinion polls are not systematically biased toward either party. This is also my expectation here, as there is no reason to believe that some parties, across time and space, are more difficult to poll. In other words, I have no reason to expect that the correlations above will differ across party families.
For this analysis, I rely on the measure of accuracy for a party $i$ proposed by Arzheimer and Evans (2014, p. 33):
$$ A’_{i} = \ln \left( \frac{p_{i}}{1 -\ p_{i}} \times \frac{1 -\ v_{i}}{v_{i}} \right) $$
Where $p$ is the proportion of votes a party gets in a poll and $v$ is the proportion of votes a party gets in the election. A positive value indicates a bias in favor of party $i$, whereas a negative value indicates a bias against party $i$. A value of 0 indicates that there is no bias in the estimate. Importantly, we are here not only interested in the magnitude of poll errors, but the direction of such errors.
The figure below shows the distribution of the estimates within eight different party families: Christian democracy, Communist/Socialist, Conservative, Green/Ecologist, Liberal, Right-wing, Social democracy, and Special issue. In the best of all worlds, we would like all estimates to be exactly 0. In the second-best world, we would like the estimates to be distributed symmetrically around 0 with as little variation as possible. The vertical dashed line within each panel indicates the average accuracy for each party family.
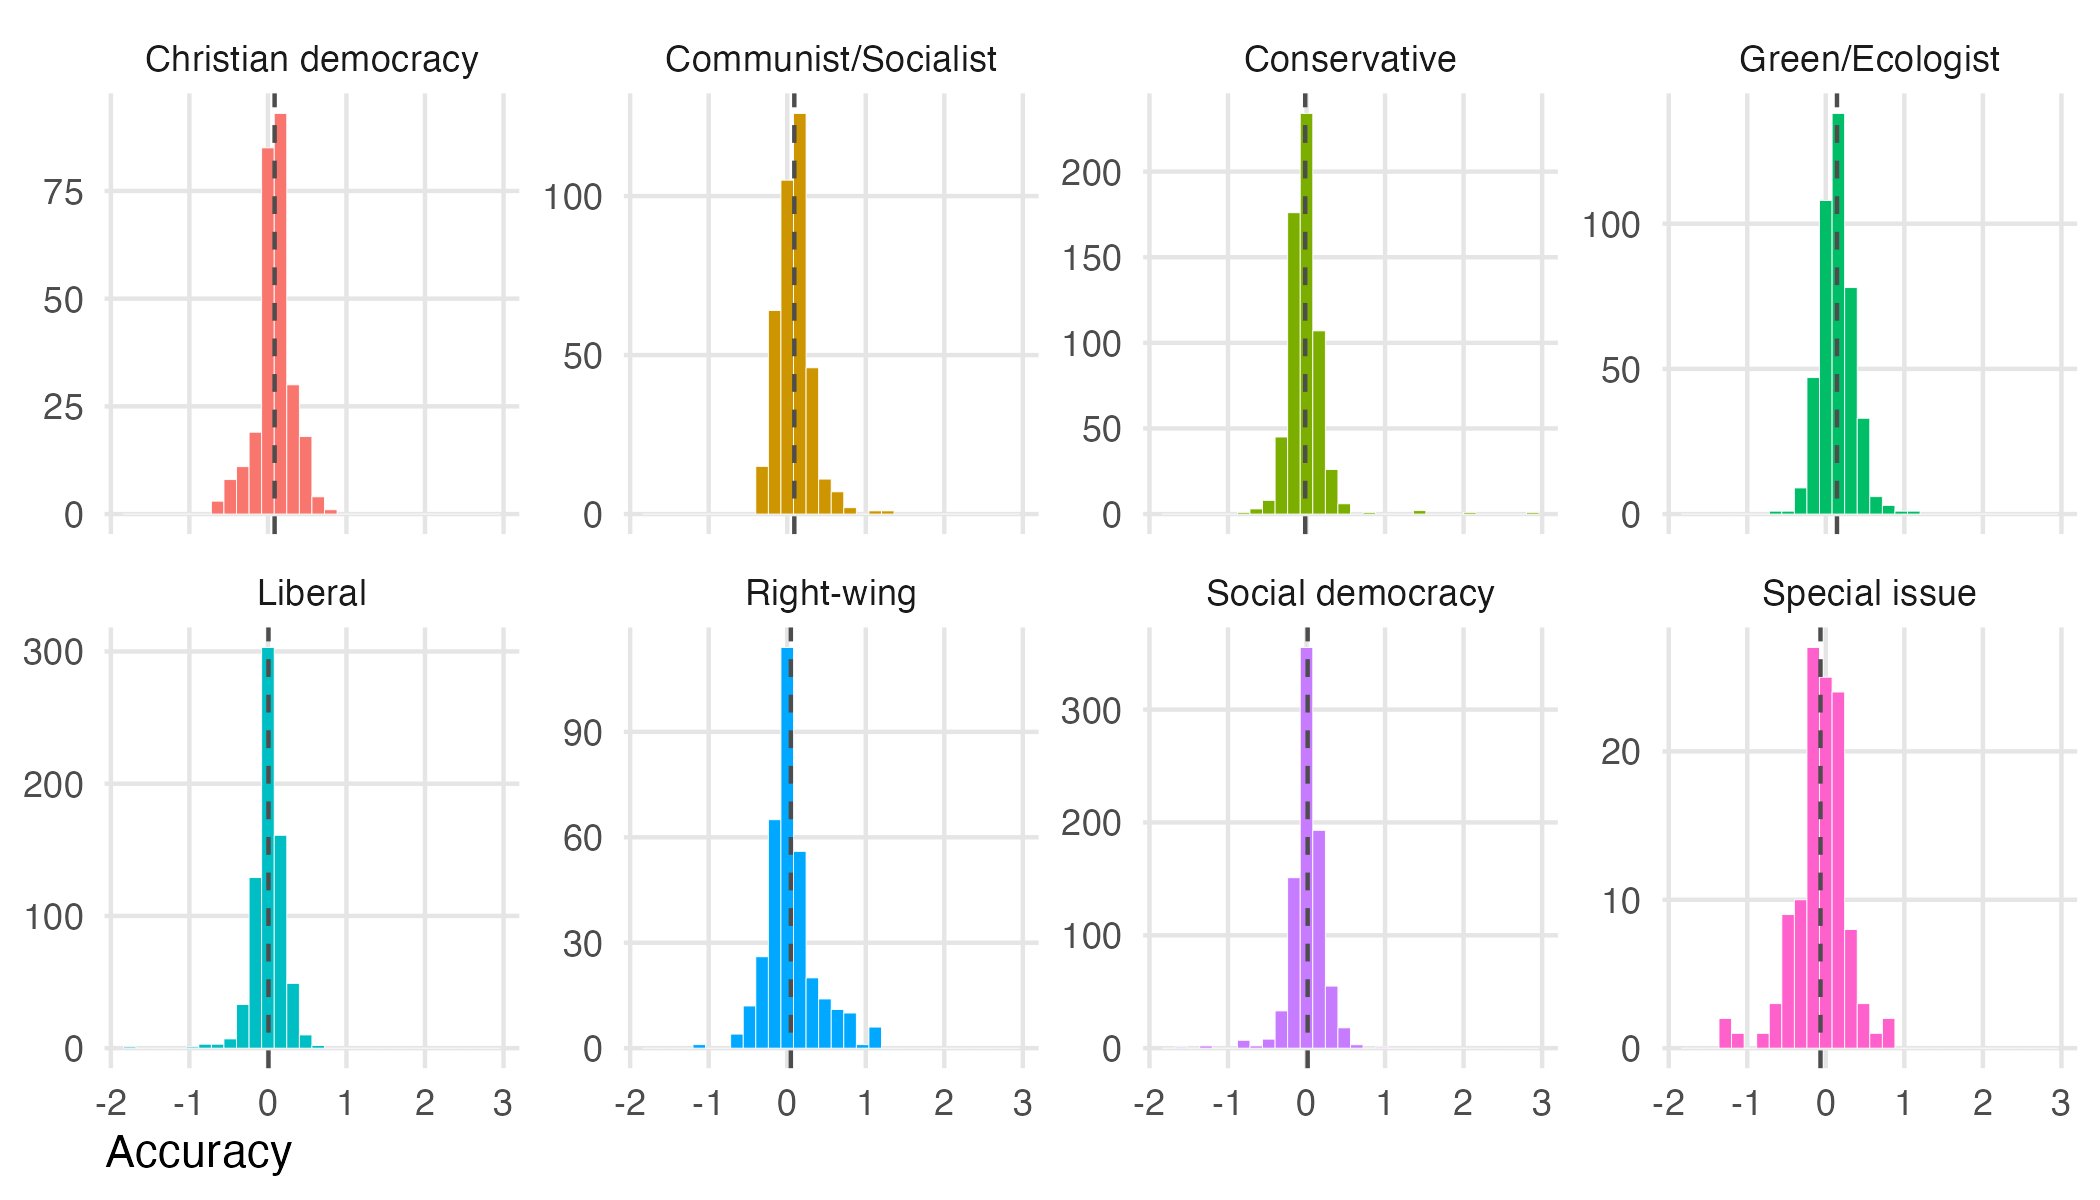
In brief, I find no systematic pattern of opinion polls being systematically and significantly biased towards specific party families. While there are multiple examples of opinion polls being wrong, we see such examples within all party families and in both directions. In brief, if we are to understand when opinion polls are more likely to be inaccurate, the party family of a political party is not a good predictor.
This is not to say that we cannot understand why and when opinion polls are more likely to get it wrong. For example, an obvious predictor is the size of the political party being polled. The closer a party is to 50% of the vote share, the greater the margin of error, but the greater the likelihood that the polls will get it wrong (and even be outside the margin of error). Accordingly, when there are multiple smaller parties, it seems like the opinion polls have an easier time not making substantial errors.
In addition, it is important to notice that opinion polls are much better in some countries. In the table below, I show the top five countries in terms of having the smallest average errors (Denmark, Norway, Greece, New Zealand, and Sweden). The error metrics in the table are the mean absolute error (MAE) and the root mean squared error (RMSE).
| Country | MAE | RMSE | Estimates | Elections | |
|---|---|---|---|---|---|
The results show that, on average, in the days prior to the election, each poll estimate in Denmark is less than a percentage point away from the election result. This is really good. In general, the Scandinavian countries perform well.
There is a lot more work to be done with the data, and it is a lot of work to double check all estimates and make sure that they are correct (especially for the poll numbers that differ a lot from the respective election results). In the future, I hope to address a few specific challenges:
- Data on don’t know. Some opinion polls also report information on the number of people that did not give an answer in the poll (e.g., refused to answer or did not know what party to vote for). Alas, there is no standardised way polling firms report these numbers, but I would like to collect more data on how many respondents in a poll gave a party preference (also to get a sense of the actual sample size that should we used to calculate the margin of error).
- Method. When possible, I have already collected a lot of data on the method of data collection used by different polling firms, but I would like to expand this data.
- Turnout. Daoust (2021) showed that there is no evidence that turnout correlates with polling errors. I find the analysis sensible but I am not convinced by the framing of the paper, i.e., that we should be looking at the actual turnout of an election rather than the estimated turnout. My hypothesis is that the more the estimated turnout by a polling firm differ from the actual turnout, the greater the polling error.
- Party data. Above I only looked at the party family of the parties of interest, but it will be relevant to include more data on parties, including whether they are running for the first time and whether they have made significant changes between two elections (e.g., leadership and policy changes).
- Missing data. There is still a lot of missing data. For example, in Israel, I do not have vote share numbers from the polls, only the estimated number of mandates according to the poll. I expect data availability to be a concern here, but it would still be good to see less missing data (also in terms of the elections and countries being covered).
In sum, opinion polls perform well in parliamentary elections, but they are more often wrong than we should expect when we rely on 95% confidence intervals.