There is an increasing focus on interpreting the practical significance of effects in the social sciences (Bernardi et al. 2017; Gross 2015). A p-value is rarely, if ever, sufficient to examine the validity of a hypothesis of interest. While a large sample can ensure sufficient statistical power, it will also, all else equal, increase the chances of finding statistical significance when effect sizes are small. Importantly, a large sample size or a small p-value is of little informative value without knowledge of the actual magnitude of an effect. Similarly, we cannot necessarily conclude that a p-value of .06 is weaker evidence for a hypothesis than a p-value of .04. Nonetheless, many studies rely heavily on the .05 significance level to validate their findings.
Specific approaches have suggested to assess the practical significance of a result in political science. Rainey (2014), for example, suggests that researchers use 90% confidence intervals to argue for a negligible effect. Gross (2015) suggests null hypothesis significance testing alongside an assessment of what parameter values should be considered to have real-word implications. While these studies provide sensible advice and illustrate that political scientists have tools at their disposal to examine the magnitude of effects beyond statistical significance, limited attention has been devoted to the actual distribution of effect sizes in the literature.
In political science, as in related fields, the strength of an empirically identified relationship is often estimated with the Pearson correlation coefficient. While researchers can rely on and interpret such correlation coefficients, there is no empirical guidance on when such correlations are small and large. Instead, researchers often interpret such effects in isolation, or even worse, provide no interpretation of the effect size at all.
In psychological research, Cohen (1992) proposed that .1, .3 and .5 should be interpreted as small, medium and large correlations, respectively. However, based on actual empirical distributions of effect sizes, at least in psychological research, effect sizes are rarely as large as we should expect. Richard et al. (2003) found that social psychological effects typically yielded a correlation coefficient of .21. Paterson et al. (2015) found, when looking at data from 250 meta-analyses, that .12, .20, and .31 constitute small, medium and large correlations, respectively. Similarly, Gignac and Szodorai (2016) suggest, based on 708 meta-analytically derived correlations, that small, medium and large correlations should, in the absence of any other information, should be understood as .1, .2 and .3.
Lovakov and Agadullina (2021) studied 12,170 correlation coefficients and find that 0.12, 0.24, and 0.41 are small, medium and large effects. Funder and Ozer (2019) found that larger effect sizes (i.e., greater than .40) are unlikely in psychological research and possibly indicate an overestimation. Unfortunately, similar attention has not been paid to the issue in political science.
To shed light on the effect sizes in the political science literature, I collected some data on effect size estimates available in meta-analyses in fields related to political science. The meta-analysis is one of the tools political scientists rely on to systematically assess a set of empirical findings (Dacombe 2018). The advantage of the meta-analysis relative to other types of reviews is that it provides quantitative information on the effect sizes within a body of research, commonly in the form of Cohen’s d or Pearson’s r. The information provided by both enables analysis across different domains, including assessments of whether effects are small or large.
To get an overview of the effect sizes available in the literature, I identified meta-analyses related to politics with sufficient information on the effect sizes of the individual studies included in the meta-analyses. That is, the unit of analysis will be the individual effect sizes within the meta-analysis. There is no clear definition of what constitutes the population of meta-analyses in politics, so the approach used here identified meta-analyses with an explicit focus on politics and meta-analysis. Using Google Scholar, I searched for “meta-analysis” in a series of political science journals. In addition, I made a general search with the terms “meta-analysis” and “political”.
The search resulted in 33 meta-analyses reporting a total of 6,726 effect sizes. For each of these meta-analyses I collected information on the individual studies, their respective number of observations, the effect size, and the source of the information. The search for meta-analyses also returned multiple articles within the literature that did not provide sufficient information to be included here or did not qualify as a meta-analysis (e.g., systematic reviews/meta-regressions and vote count techniques). As the direction of the effects is not my main focus here, negative effect sizes were transformed into absolute values. Cohen’s d effect sizes were transformed into Pearson’s r. The R package esc was used to transform all effect sizes into Pearson’s r.
The table below provides an overview of the meta-analyses with information on the studies included in each, the total N, and the lowest, medium and largest effect sizes reported within the meta-analysis (based on 25, 50 and 75 quartile partitions). Out of the 6,726 effect sizes, the sample size was not available for 512 effect sizes. The total number of observations across the meta-analyses with sample size information is 19,663,009.
| Study | Effect sizes | Total sample size | |||
|---|---|---|---|---|---|
| L (25) | M (50) | H (75) | |||
In the figure below, I explore the distribution of effect sizes within the meta-analyses. Each dot represents an effect size in the meta-analysis and the box plot for each study shows the median, the first quartile and the third quartile. The figure shows substantial variation across the different meta-analyses but also demonstrates that in a majority of the meta-analyses, it is the exception rather than the norm for effect sizes to be above .5.
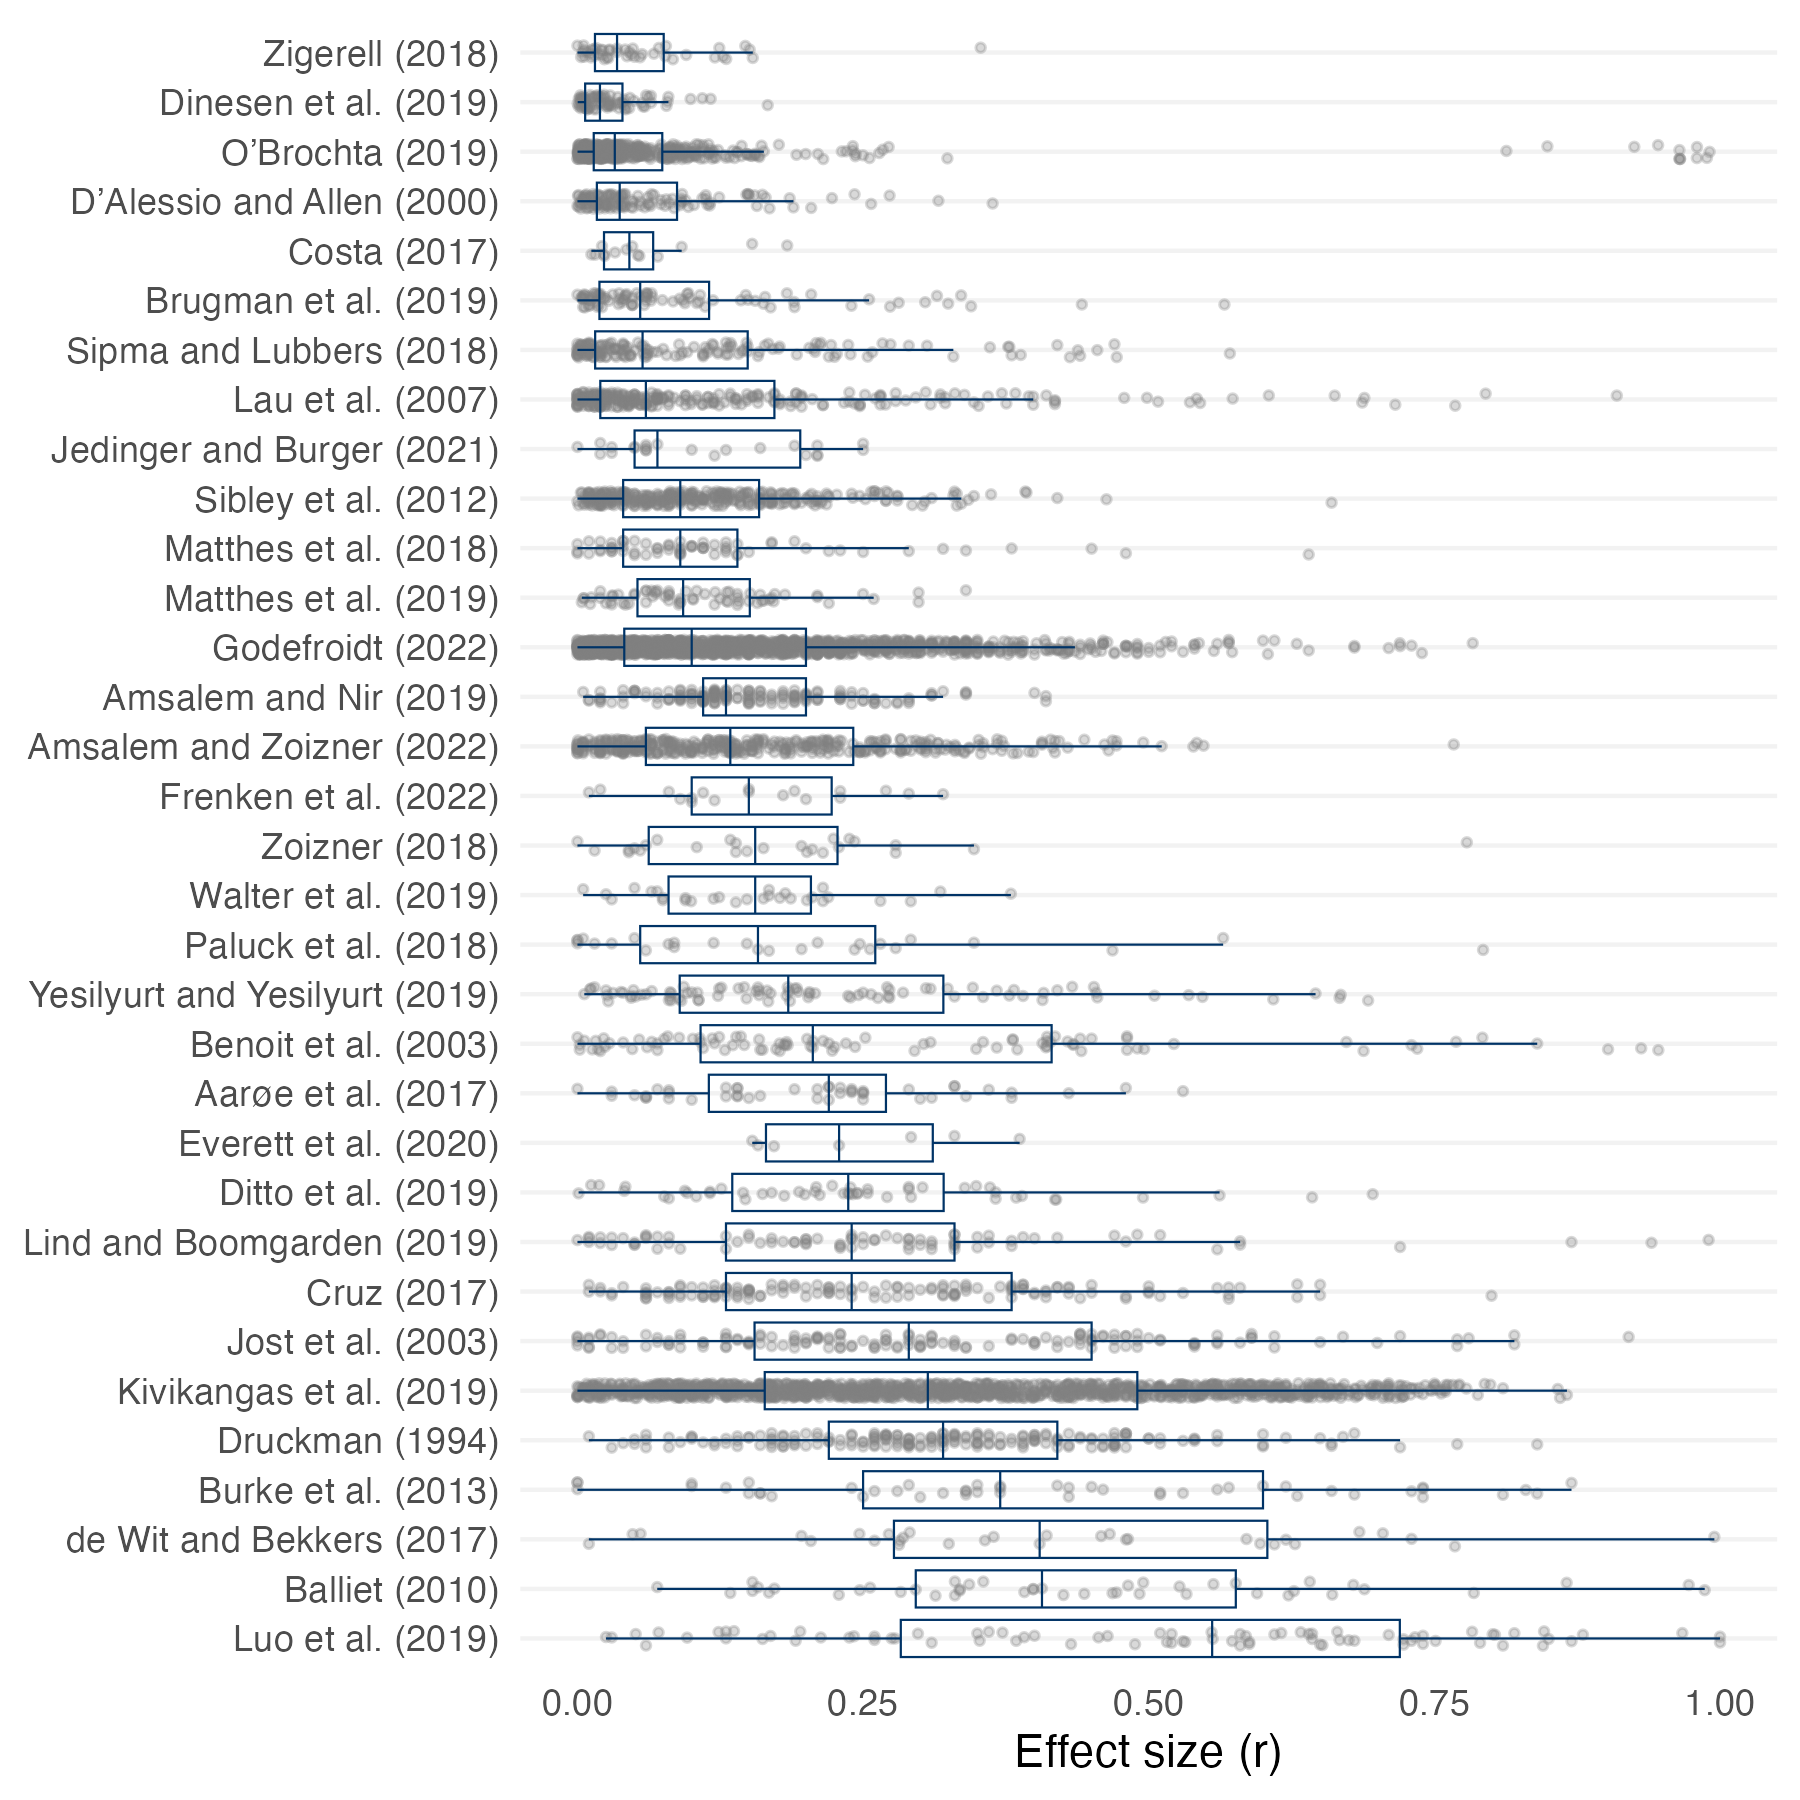
Most meta-analyses have median effect sizes below .25. In the full sample of effect sizes, the median effect size is .14. However, there is substantial heterogeneity in the meta-analyses. Notably, most of the reported effects in this meta-analysis rely on a small number of observations (the median sample size is 303). There is a strong correlation between the sample size and the reported effect size (the correlation between the sample size (log) and the effect size is -.31). As correlations become more stable as the sample size increases (Schönbrodt & Perugini 2013), there is little reason to expect that the effect sizes relying on very small samples are valid. Instead, they are more likely to contribute to the false notion that we should expect large effects.
There is no evidence in the data that effect sizes differ over time. While most correlations reported in the meta-analyses are from within the recent decades, the correlation between the year of publication of a study and the effect size is small (r = -.07). In sum, the median effect size in the literature is .14. 25% of all effect sizes are below .05. 25% of the correlations are greater than 0.29.
Do we have sufficient data to estimate effect sizes of interest to make confident conclusions about political phenomena? Traditionally, the heuristic of interest has been that of statistical significance, i.e., whether an effect has a p-value that is statistically significant at a level that warrants an asterisk in a regression table, often at the .05 level. Focusing on effect sizes highlights the importance of sample size in relation to publication bias. For example, Gerber et al. (2001) use publications on the effectiveness of political campaigns to show a strong negative relationship between sample size and effect size. Interestingly, only 9.7% of the effect sizes in the dataset explored here have sufficient statistical power to identify a small effect. This small number is consistent with a similar recent study by Arel-Bundock et al. (2022). Similarly, a power analysis of RDD studies found that most studies were underpowered (Stommes et al. 2021).
A recent megastudy within applied behavioural science found that experts believe effect sizes are ten times greater than they actually are (Milkman et al. 2021). While there is no empirical evidence of a similar discrepancy between beliefs and actual effect sizes within the political science literature, it is important to ensure that we have realistic, empirically derived estimates on the actual effect sizes within the literature.
In sum, in line with results from psychology, studies are often underpowered and effect sizes are, on average, small in magnitude. The recommendation here is that political science researchers should plan for small effects when designing studies and, all else equal, consider correlations of .05, .15 and .30, as small, medium and large effects, respectively.