In 2018, I wrote a post about a data visualisation showing that the age you consider ‘old’ is the square root of your age times 8. So if you are 25 you will consider 40 to be old. In brief, my main problem with the data visualisation was the low N (~200), i.e., the small sample size used to make a general rule about how to assess at what age people are considered old for different age groups.
The other day I saw a tweet linking to my blog post. Interestingly, the person behind the tweet did not read my blog post and shared the data visualisation with the “square-root of your age times 8” rule.
The good thing is that some people bothered to reply to the tweet with the point I raised in my blog post. One person, for example, said: “The strange thing about this tweet is that the source cited is a blog post that’s about how the 8*sqrt(age) formula is over-fitting a limited amount of data and DOESN’T really describe the trend or match other studies that use more data points.”
The problem is that people love equations. It is easier to remember the “square root of your age times 8” rule than the empirical criticism of said rule.
For that reason, I decided to look at the data again and explore whether I can propose an alternative equation based on the data. As the trend seems to be linear, one possibility is to simply use the regression coefficients from a linear model. Here our rule will be 56.02 + 0.15 * age. That is, by putting in your own age in the equation, you can get a good sense of what people, being your age, on average, considers old.
One problem is that there are decimal places and no round numbers. There is not even a square root! It might for that reason be difficult to remember. Instead, I came up with the following rule: 50 + the square root of your age times 2. The figure below shows all the data (as introduced in my previous post). The blue line is a loess regression line fitted to the data. The orange line is the sqrt(age)*8 and the red line is 50+sqrt(age)*2.
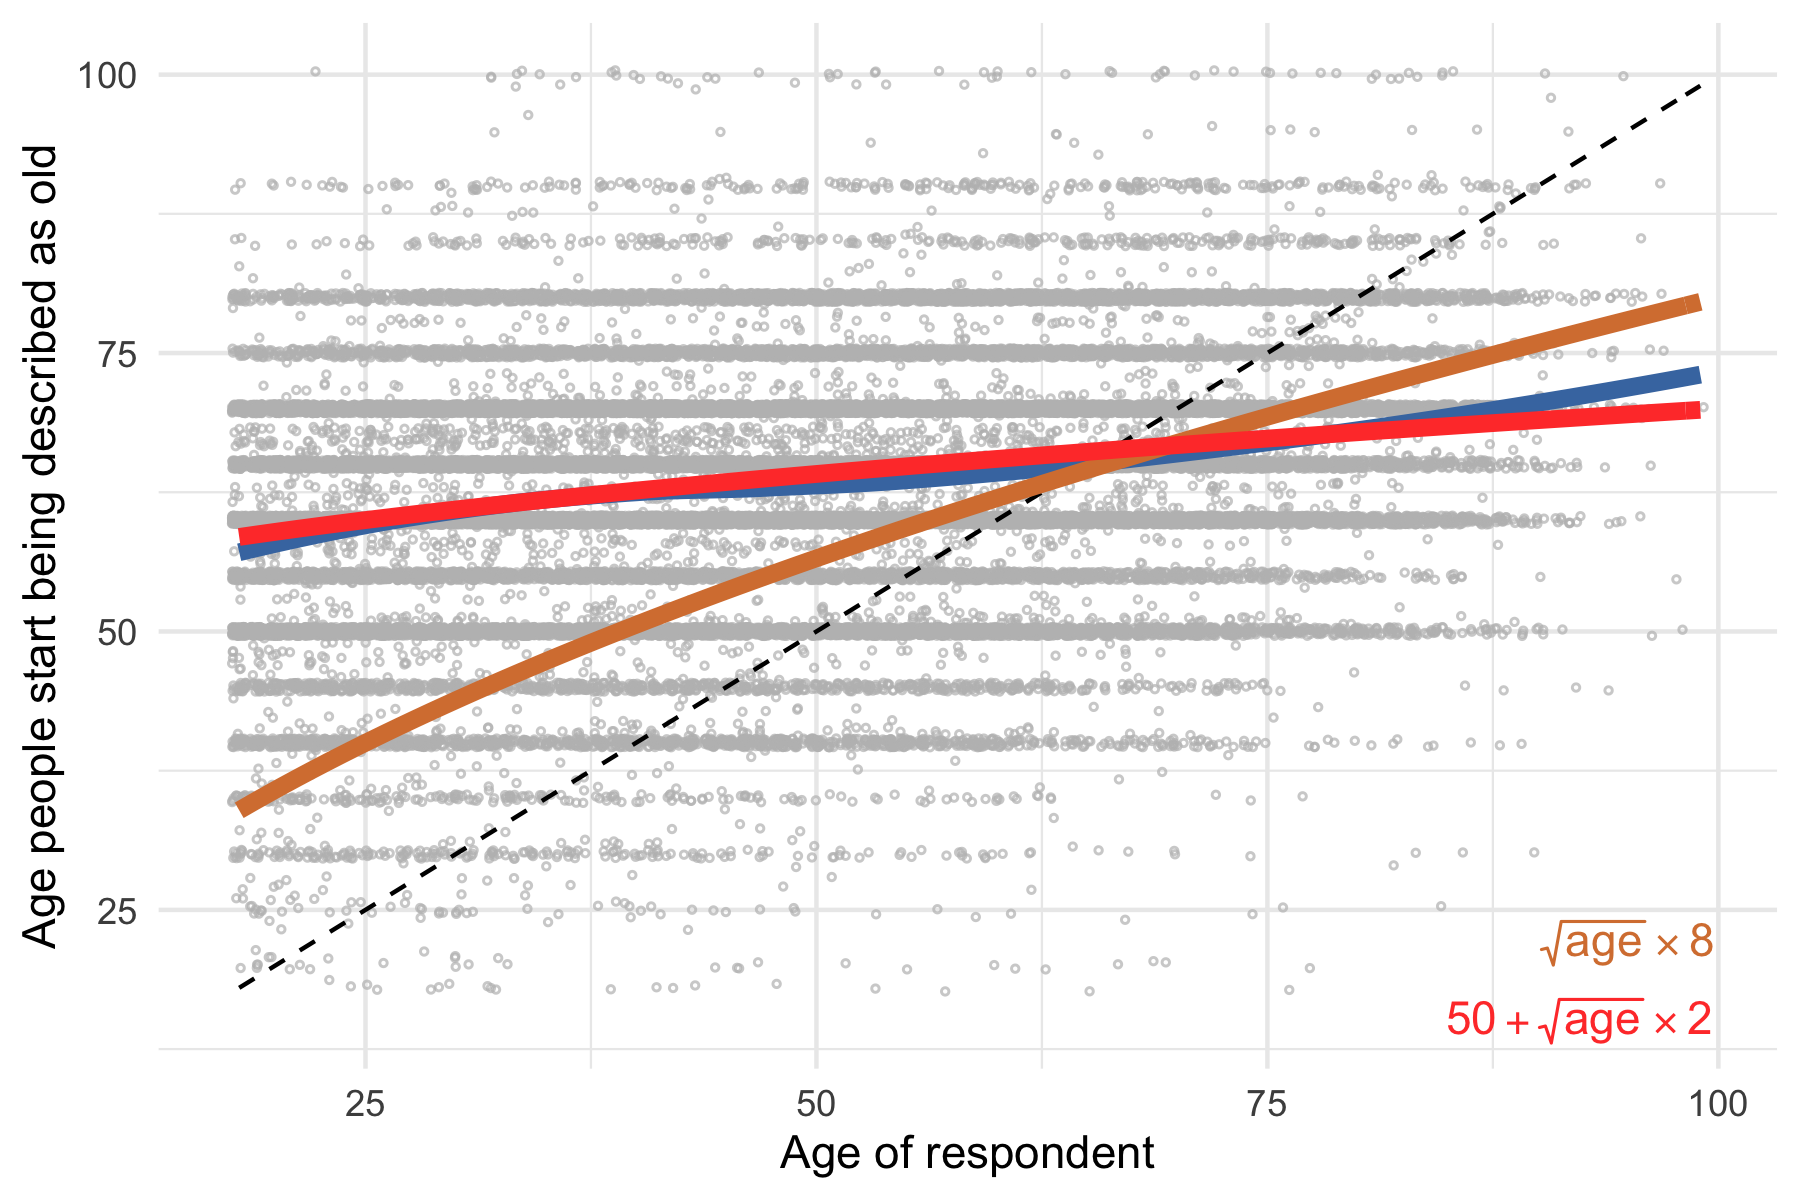
The slope of the line is much flatter than we would expect based on the original suggestion. For that reason, we need an intercept and a much smaller slope. Simply put, on average, young and old people agree a lot more about when people should be considered old than we might expect.
Noteworthy, the age of the respondent can only explain six percent of the variation in the age people start being described as old. You can see in the figure that even among young people, there is no agreement on when exactly people should be considered old.
In sum, here is the new rule: $ 50 + \sqrt{age} * 2 $.