I was reading this study on the impact of Weberian bureaucracy on economic growth published in Comparative Political Studies. It’s a great article and I can highly recommend reading it.
I like that the study presents most of the results in figures. In fact, there are more figures than tables in the article. However, a few of the figures present several data points (countries) in scatter plots with labels to all points (country names). Here is one example:
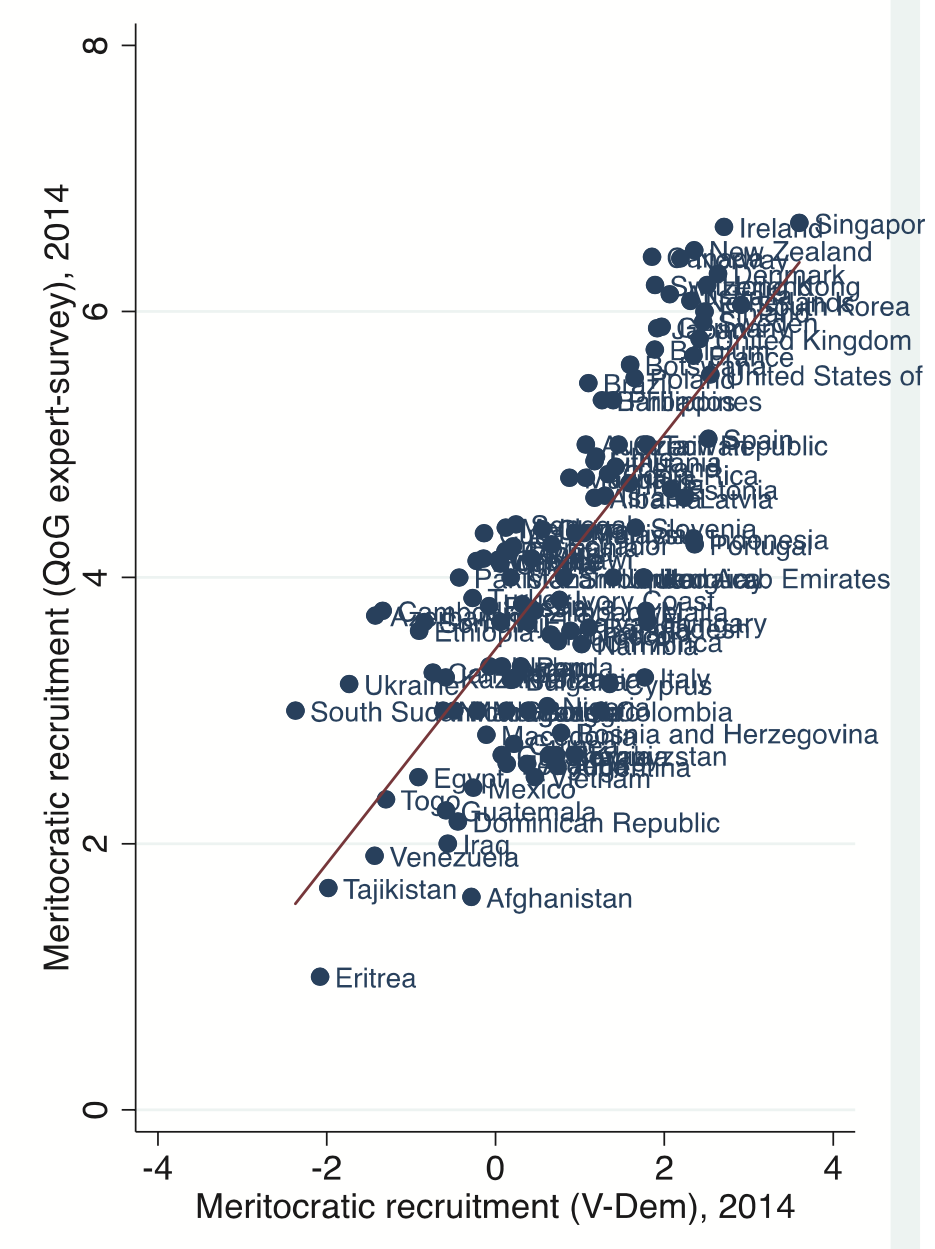
As you can see, several country labels overlap with each other making it difficult to read the country names. The problem is not as severe as it could have been (as the authors have made the height greater than the width, making more space for horisontal text). However, for a lot of the labels it is simply not possible to read the country names.
Importantly, this is not only about aesthetics. When several country labels overlap, it is no longer possible to see whether there are actual data points hidden by the labels.
To improve the figure, my suggestion would be to only show some of the value labels. In the figure below I have tried to only show the country names for the countries that you can actually read in the figure above.
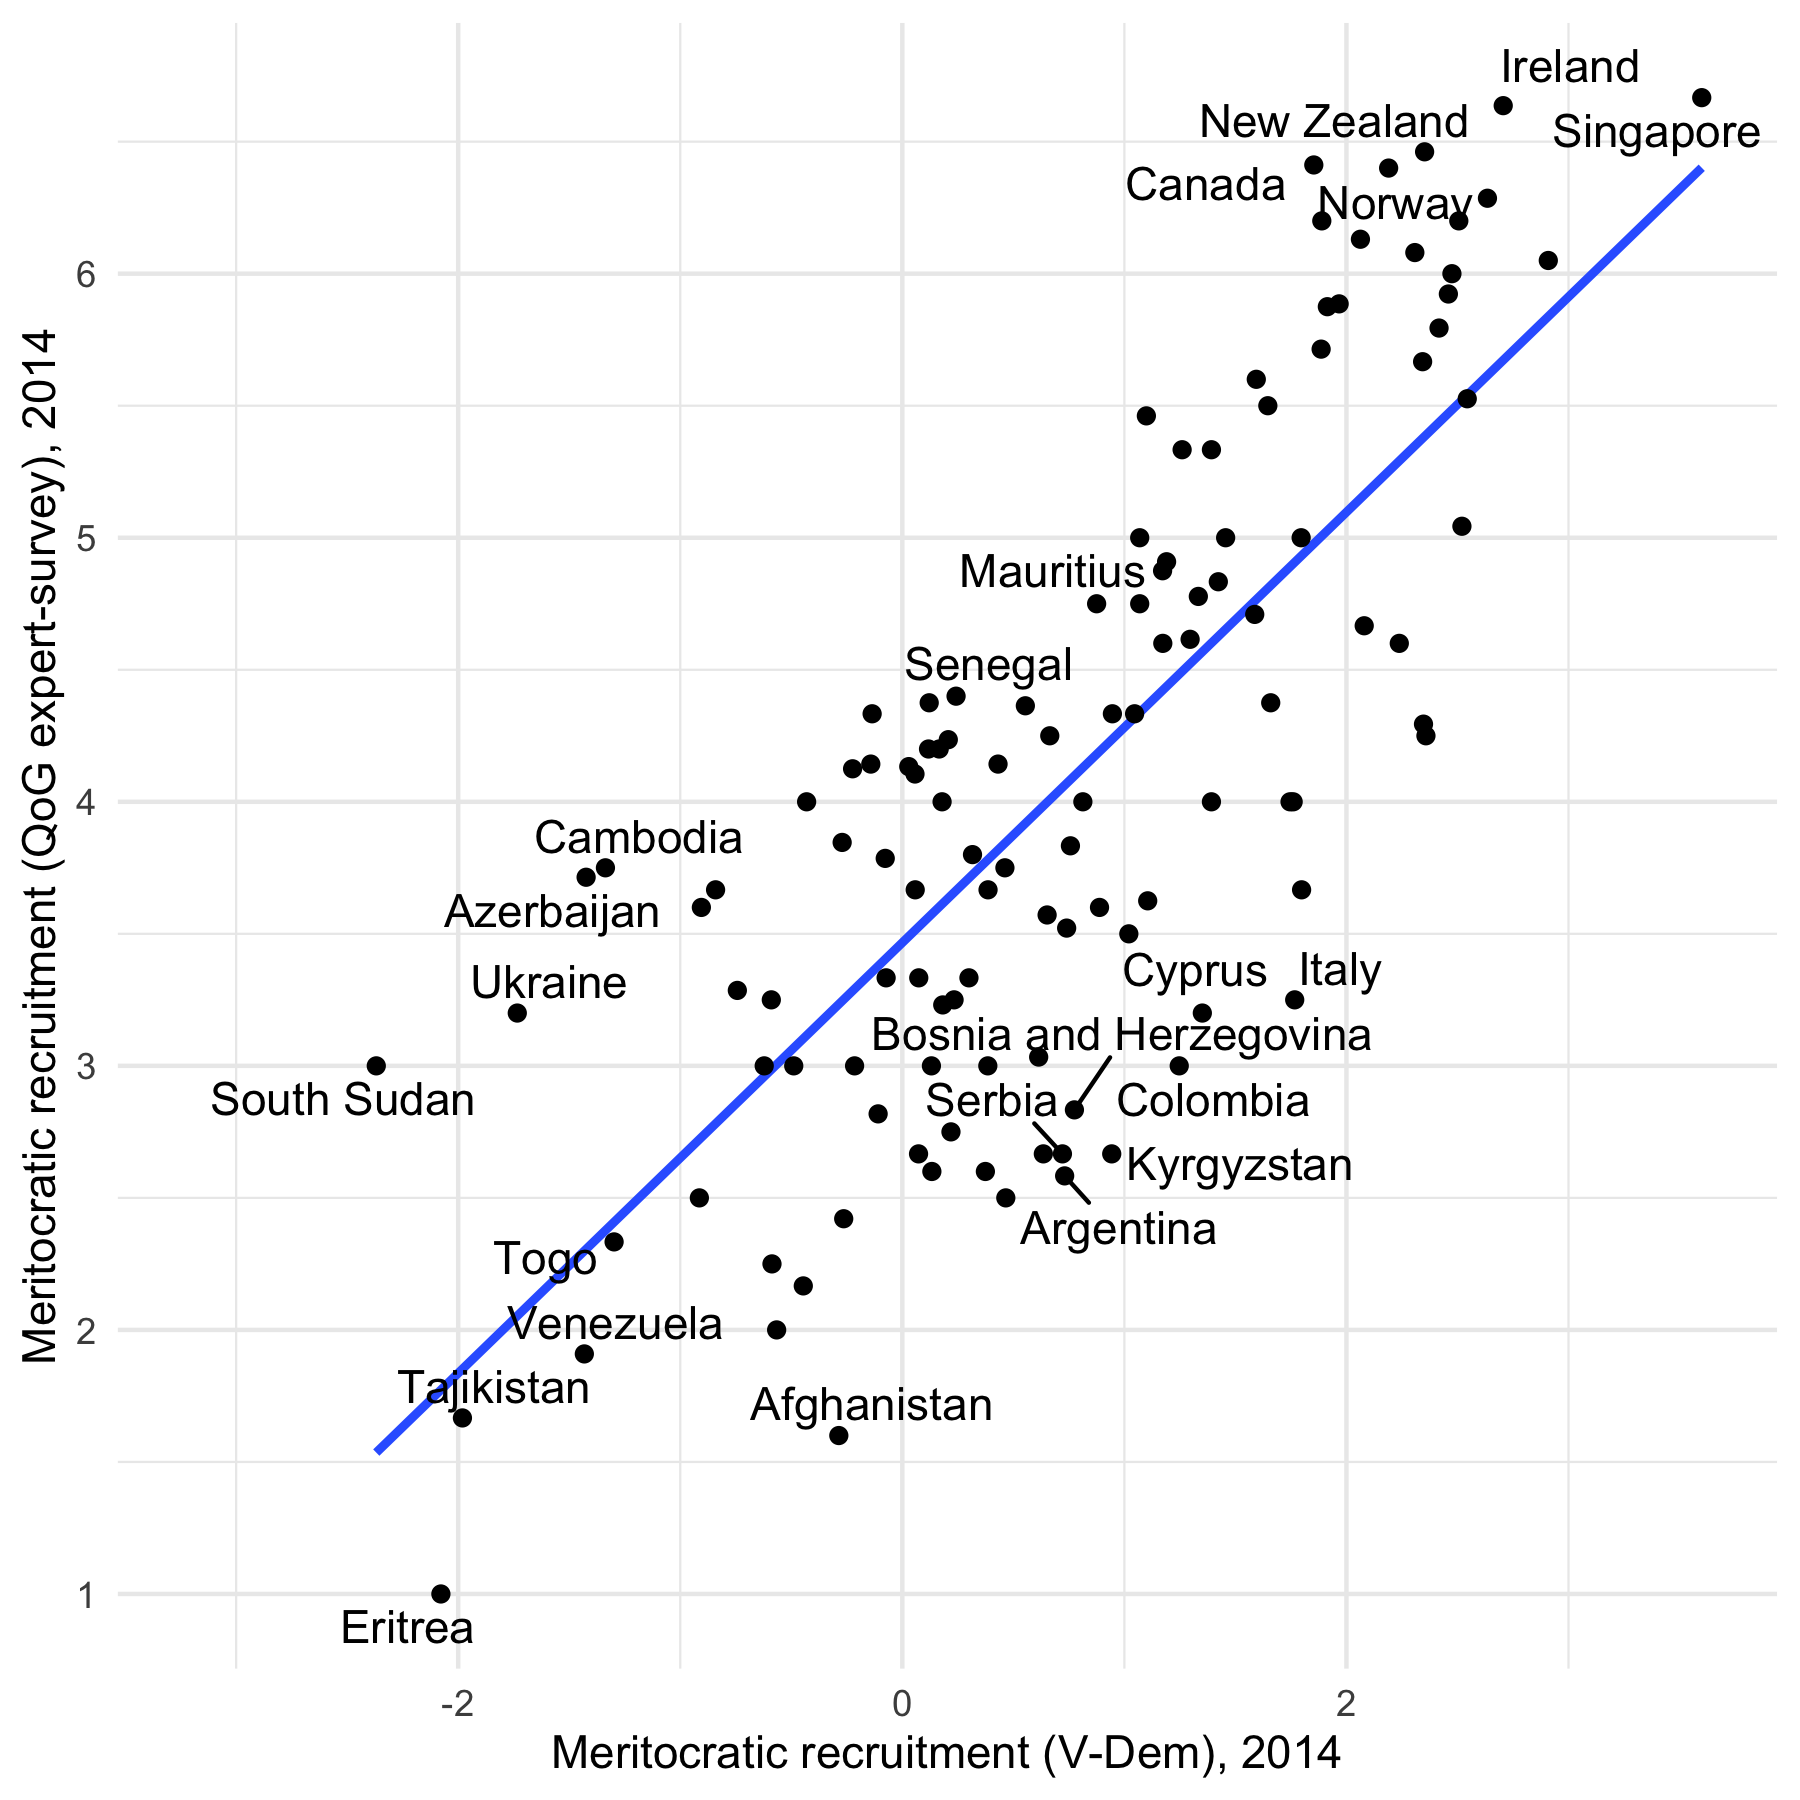
In my view, this is a clear improvement of the original figure.
My R-script to create the figure is here:
library("tidyverse")
library("haven")

bureaucracygrowth <- read_dta("22725104_Replication_data_Bureaucracy_Growth.dta")

bureaucracygrowth %>%
  mutate(country_name_show = case_when(
    v2stcritrecadmv9 < -1  ~ country_name,
    QoG_expert_q2_a > 6.3 | QoG_expert_q2_a < 2 ~ country_name,
    v2stcritrecadmv9 > 0.7 & QoG_expert_q2_a < 3.5 ~ country_name,
    v2stcritrecadmv9 < 1 & QoG_expert_q2_a > 4.4 ~ country_name,
    TRUE ~ ""
  )) %>%
  ggplot(aes(v2stcritrecadmv9, QoG_expert_q2_a)) +
  geom_smooth(method = "lm", se = FALSE) +
  ggrepel::geom_text_repel(aes(label = country_name_show)) +
  geom_point() +
  theme_minimal() +
  labs(y = "Meritocratic recruitment (QoG expert-survey), 2014",
       x = "Meritocratic recruitment (V-Dem), 2014")

ggsave("bureaucracygrowth.png", width = 6, height = 6)