There is an important distinction between reproduction and replication in scientific research. Reproduction is when you use the same data from a study to (re)produce the findings in that particular study. Replication is when you use different data to examine whether you will get the same results (i.e. cross-validation).
I often think about this distinction when I encounter research I would like to replicate. For example, when the sample size is small or the statistical models rely on arbitrary choices, I see an urgent need to replicate a study to see whether the findings generalise beyond the specific study. However, it is expensive to replicate a study. What I end up doing instead is, whenever possible, to access the data, reproduce the findings and see how robust these findings are to (simple) alternative model specifications.
In a lot of cases I find that it would be a waste of resources to even try to replicate the study of interest. Accordingly, there is a temporal order of importance when we engage with the validation of research, namely: reproduce before you replicate. If the reproduction of a study shows that the evidence presented is weak, that should factor into our considerations of whether it is worth the time and money to pursue a replication.
I was thinking about this when I saw a replication study published in the Journal of Politics (a better-than-average journal within political science). In brief, the study is unable to replicate a study published in Science. What caught my interest was this recommendation made by one of the authors on Twitter: “Show maximum caution with psychophys until these issues have been solved. Resources and careers can disappear into this black hole. This null finding costed us about $80,000, 4 years of postdoc salary and more headaches than I can count.”
Why did I find this point interesting and important? Because I read the original study in Science years ago, found it interesting and decided to look into the study. And decided to not pursue any research taking this specific study serious. Headache count: 0. In brief, I quickly decided that it would be a waste of resources to expect anything else than a null finding. (Not that there is anything wrong with replicating a null finding.) It took me a few minutes and an open source statistical software which – for the record – was significantly less costly than $80,000.
The original study in Science, published in 2008, is titled ‘Political Attitudes Vary with Physiological Traits‘. There are a lot of red flags that we should pay attention to, such as the data (e.g. a small sample size, total N = 46) and the statistical models (e.g. several covariates).
There is a statistically significant result. However, unsurprisingly, the results are not robust to even simple model specifications (one might say especially to simple model specifications). Interestingly, one of the key findings in the paper is only significant when we include education as a (misspecified) covariate in our model.
I will not go into too much detail here with what the paper is about. Do read the paper if you are bored though. The only thing you need to understand here is that we are interested in the variable ‘Mean amplitude’. Model 1 in the table below replicates the results in Table 3 in the paper. As we can see, the coefficient and the standard error confirm that there is indeed a statistically significant effect (p < .05). In Model 2, we run a simple bivariate OLS regression (i.e. without all the covariates) and see that the finding is no longer anywhere near statistical significance. In Model 3, we add all covariates except for education and see that there is still no significant effect. It’s only when we add education to the model that we find a significant effect.
One might say that this is not an issue. Maybe it is even important to take differences in education into account? Maybe. However, even if this is the case, we should make sure that we don’t treat an ordinal variable as a continuous variable in our models. Education is measured with different categories and we should take this into account in the models. I do that in Model 4 and 5 below, and we see here that there is simply no effect of ‘Mean amplitude’.
| (1) | (2) | (3) | (4) | (5) | |
|---|---|---|---|---|---|
| Predictors | Estimates | Estimates | Estimates | Estimates | Estimates |
| Mean amplitude | 1.67 (0.75) |
0.94 (0.87) |
1.22 (0.84) |
0.97 (0.82) |
1.11 (0.75) |
| Female | -2.72 (1.46) |
-3.05 (1.65) |
-3.85 (1.46) |
||
| Age | 0.19 (0.10) |
0.15 (0.12) |
0.16 (0.10) |
||
| Income | -0.32 (0.50) |
-0.61 (0.56) |
-0.31 (0.48) |
||
| Education | -1.76 (0.50) |
||||
| Edu: trade school | 0.42 (3.50) |
3.03 (3.29) |
|||
| Edu: some college | -4.02 (3.14) |
-4.15 (2.94) |
|||
| Edu: college grad | -1.33 (2.63) |
-0.16 (2.50) |
|||
| Edu: college degree plus | -6.88 (2.25) |
-5.86 (2.11) |
|||
| N | 46 | 46 | 46 | 46 | 46 |
| R2 / R2 adjusted | 0.375 / 0.297 | 0.026 / 0.004 | 0.178 / 0.098 | 0.325 / 0.241 | 0.480 / 0.368 |
It is possible that there is a true effect and the study was simply limited by the small sample size. However, what I am saying here is that I was not surprised to see a failed replication of the study in question and I will be extra critical towards any similar studies and how they use covariates, especially in (political science) top journals. Noteworthy, the replication study deals with several other topics and you should read that study in any case.
Importantly, this is not one unique episode and I have seen several papers where I would be surprised if a replication would find results consistent with the original study. Let’s take one extra example.
I was reading this working paper the other day, No Additional Evidence that Proximity to the July 4th Holiday Affects Affective Polarization, that is unable to replicate a finding in this study, Americans, Not Partisans: Can Priming American National Identity Reduce Affective Polarization?. Specifically, the finding in the original study (that the replication study is unable to replicate) is that proximity to the 4th of July reduces affective polarization.
Again, I was not surprised to see this failed replication as I reproduced the finding in the original study when it was published in the Journal of Politics (a decent journal within political science). Here is a summary of what the original study argues: “Subjects who are interviewed around July 4th should have a slightly more positive impression of the other party and its leaders, all else equal.” And here is the key finding: “those interviewed in the 14-day window around July 4th rate the opposing party’s nominee 1.9 degrees warmer than those interviewed at otherwise similar periods in early June or August.”
I am able to easily get that estimate but with simple robustness checks I was also able to see that a replication study would most likely not find a significant effect. In brief, I decided to reproduce the original study and assess how robust the findings were. One way to assess unconfoundedness that I looked into was to use a lagged outcome as the outcome. Here, we should definitely not find a treatment effect (a treatment should not be able to affect the past — an aspirin today should not give you a headache yesterday).
Importantly, the variables I needed to conduct such a robustness test was available in the replication material. This is because the original study argues that: “I can also guard against potential unobserved heterogeneity by using the feeling thermometer ratings from wave 2 (January–March 2008) as a control variable.” That’s a good point but I am not convinced by that analysis.
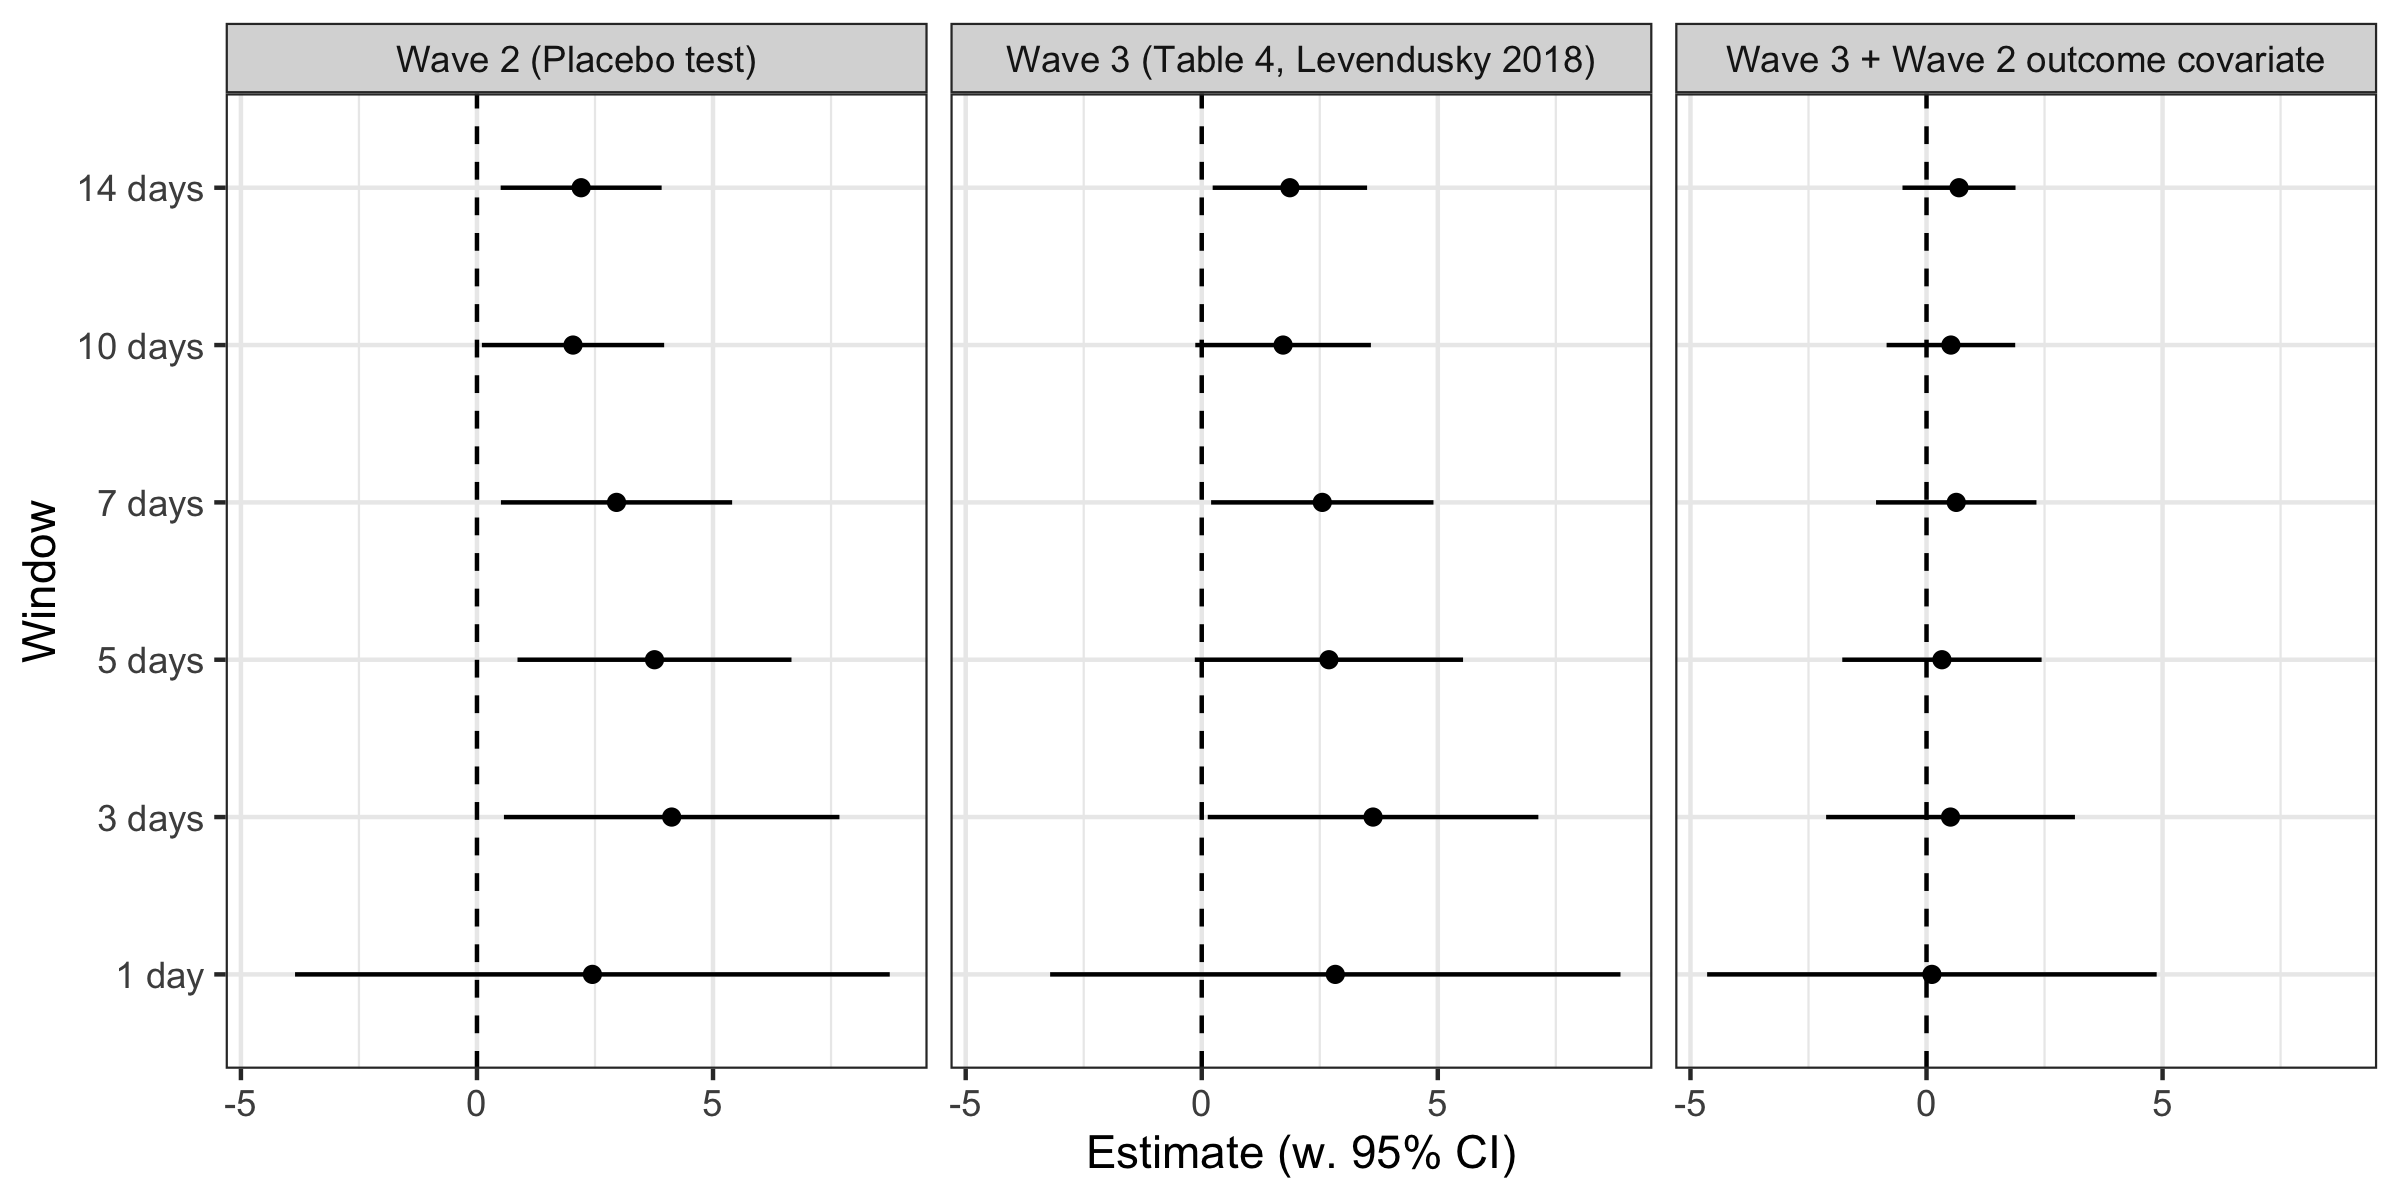
So, we have two waves of data in this study. Wave 2 (our placebo wave with no July 4th, interviews conducted January 1, 2008, through March 31, 2008; n = 17,747) and Wave 3 (our treatment wave with July 4th, interviews conducted April 2, 2008, through August 29, 2008; n = 20,052).
The problem is simple: When we look at the outcome measured before the treatment (i.e. look at Wave 2), we find a significant treatment effect similar to that reported as the key finding in the paper. This is illustrated in the left panel and the centre panel in the figure below (with varying window sizes around July 4th). In addition, when we control for the outcome measured in Wave 2, the main results disappear (see the right panel in the figure).
Again, I was not surprised to see that researchers – when trying to replicate this finding – was unable to do so. Or, in other words, I find the replication consistent with what the data actually shows when you conduct relatively simple robustness tests.
I am not picking these examples because the research is bad. Actually, my motivation is the opposite. I found these studies important and relevant for our understanding of contemporary political behaviour and I would most likely not have engaged with the data if I belived the research was bad. Also, I am not saying that any of the authors replicating these studies did not reproduce the main findings before conducting the respective replications.
Also, as anybody who has engaged with statistics know, it is always possible to “break a result”. (If you conduct enough robustness tests, these tests will at the end of the day return some false-positives just by pure chance.) I am not aware of any finding within political science that cannot “break” at some point. And just looking for an insignificant result and writing a blog post about that would be p-hacking as well. However, the reason I find the two examples above interesting is that we are pursuing very simple tests that I would not even call robustness tests but simply tests of the main effect. In other words, the question is not whether it is possible to find an insignificant result but when.
Again, I do believe that the replication studies mentioned above are worth the work and they both contribute significantly to their respective literatures. However, I do agree with the argument that not all studies are worth replicating (for more on this, see this paper by Peder Isager and colleagues). So, my recommendation: Before you replicate anything, make sure you reproduce and fully understand the robustness of the finding you want to replicate.