There are good reasons to think carefully about the y-axis when you design figures, including considerations on whether to start your y-axis at zero or not. In this post, I provide a simple piece of advice: when presenting bar charts on a linear scale, start at 0. Not 0.38. Not 0.31. Not 0.04. 0.
The figure below, from Hanel et al. (2018), depicts the same data in three panels. It shows how the same data can be presented in different ways with implications for how we perceive differences between groups.

In the first panel, we see the distributions of the two groups. In the second panel, we see that the y-axis starts at 4.6. In that figure, it looks like the value for Poland (the red bar) is three times greater than the value for the UK (the blue bar). In the third panel, relative to the second panel, we see a much better presentation of the two groups with a y-axis starting at zero.
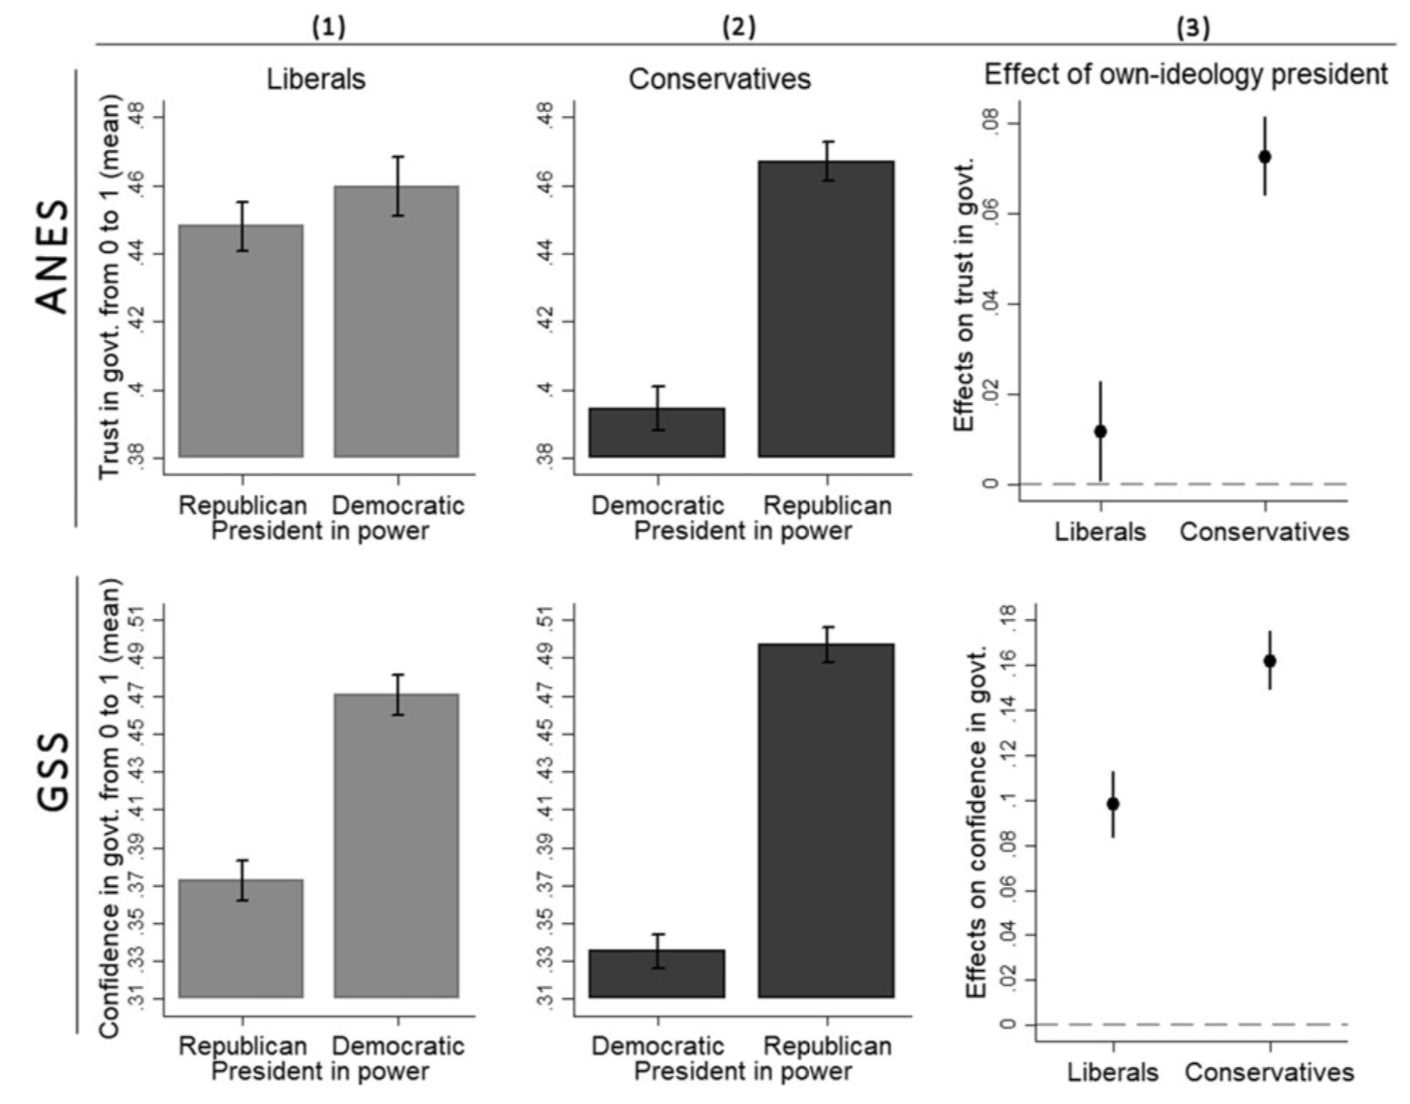
Despite the fact that bar charts with arbitrary and non-zero starting y-axes are problematic, I see it again and again in scientific publications. Take for example this new article in the American Political Science Review, where the bar charts use the y-axis to mislead. Specifically, they leave the impression of a greater difference between the two groups than is supported by the data:
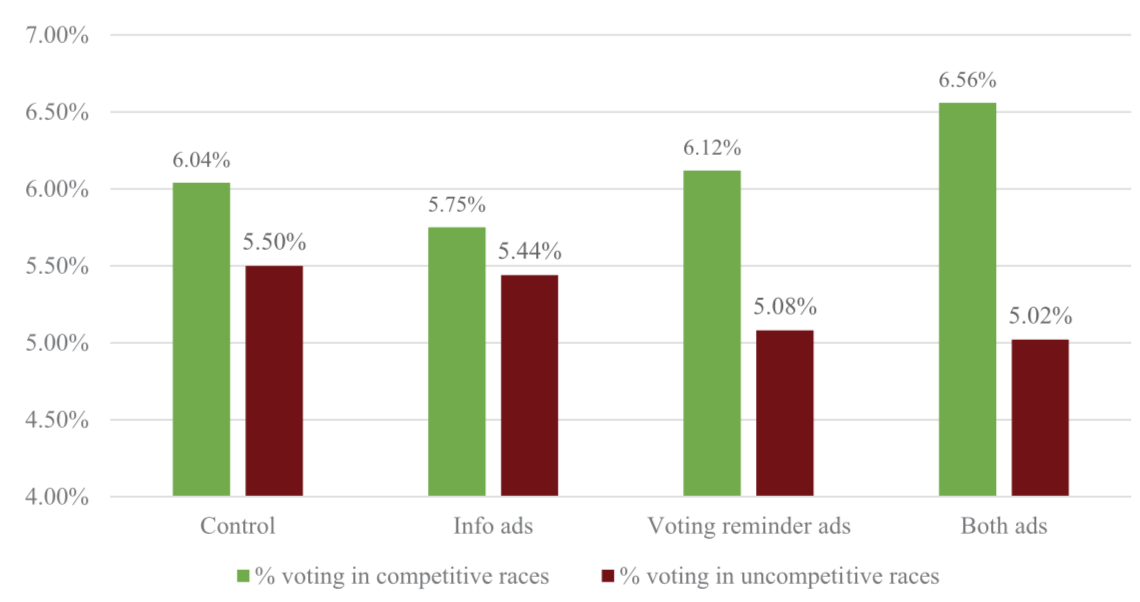
For another example, take this new article in Political Communication where the bar chart conveniently starts at 4.00% to give the impression of a large difference between the groups. (On a sidenote, I can’t believe how unlucky the authors were. The only statistical finding in the article is the finding that wasn’t preregistered.)
Alas, journals and books are filled with examples of bar charts that use the y-axis to mislead. The general issue is that these figures do not comply to the principle of proportional ink: “The sizes of shaded areas in a visualization need to be proportional to the data values they represent.”
This is not to say that y-axes should always start at zero. On the contrary, there are many cases where figures should definitely not start at zero (see this article from Quartz and this video from Vox for more information). However, when creating a bar plot, the best way to improve your figure is to comply to the principle of proportional ink. Start at 0.